171 lines
7.0 KiB
Markdown
171 lines
7.0 KiB
Markdown

|
|
||
|
|
> Name
|
||
|
|
|
||
|
|
双均线RSI动量突破交易策略-Dual-EMA-RSI-Momentum-Breakout-Trading-Strategy
|
||
|
|
|
||
|
|
> Author
|
||
|
|
|
||
|
|
ChaoZhang
|
||
|
|
|
||
|
|
> Strategy Description
|
||
|
|
|
||
|
|
|
||
|
|
|
||
|
|
[trans]
|
||
|
|
#### 概述
|
||
|
|
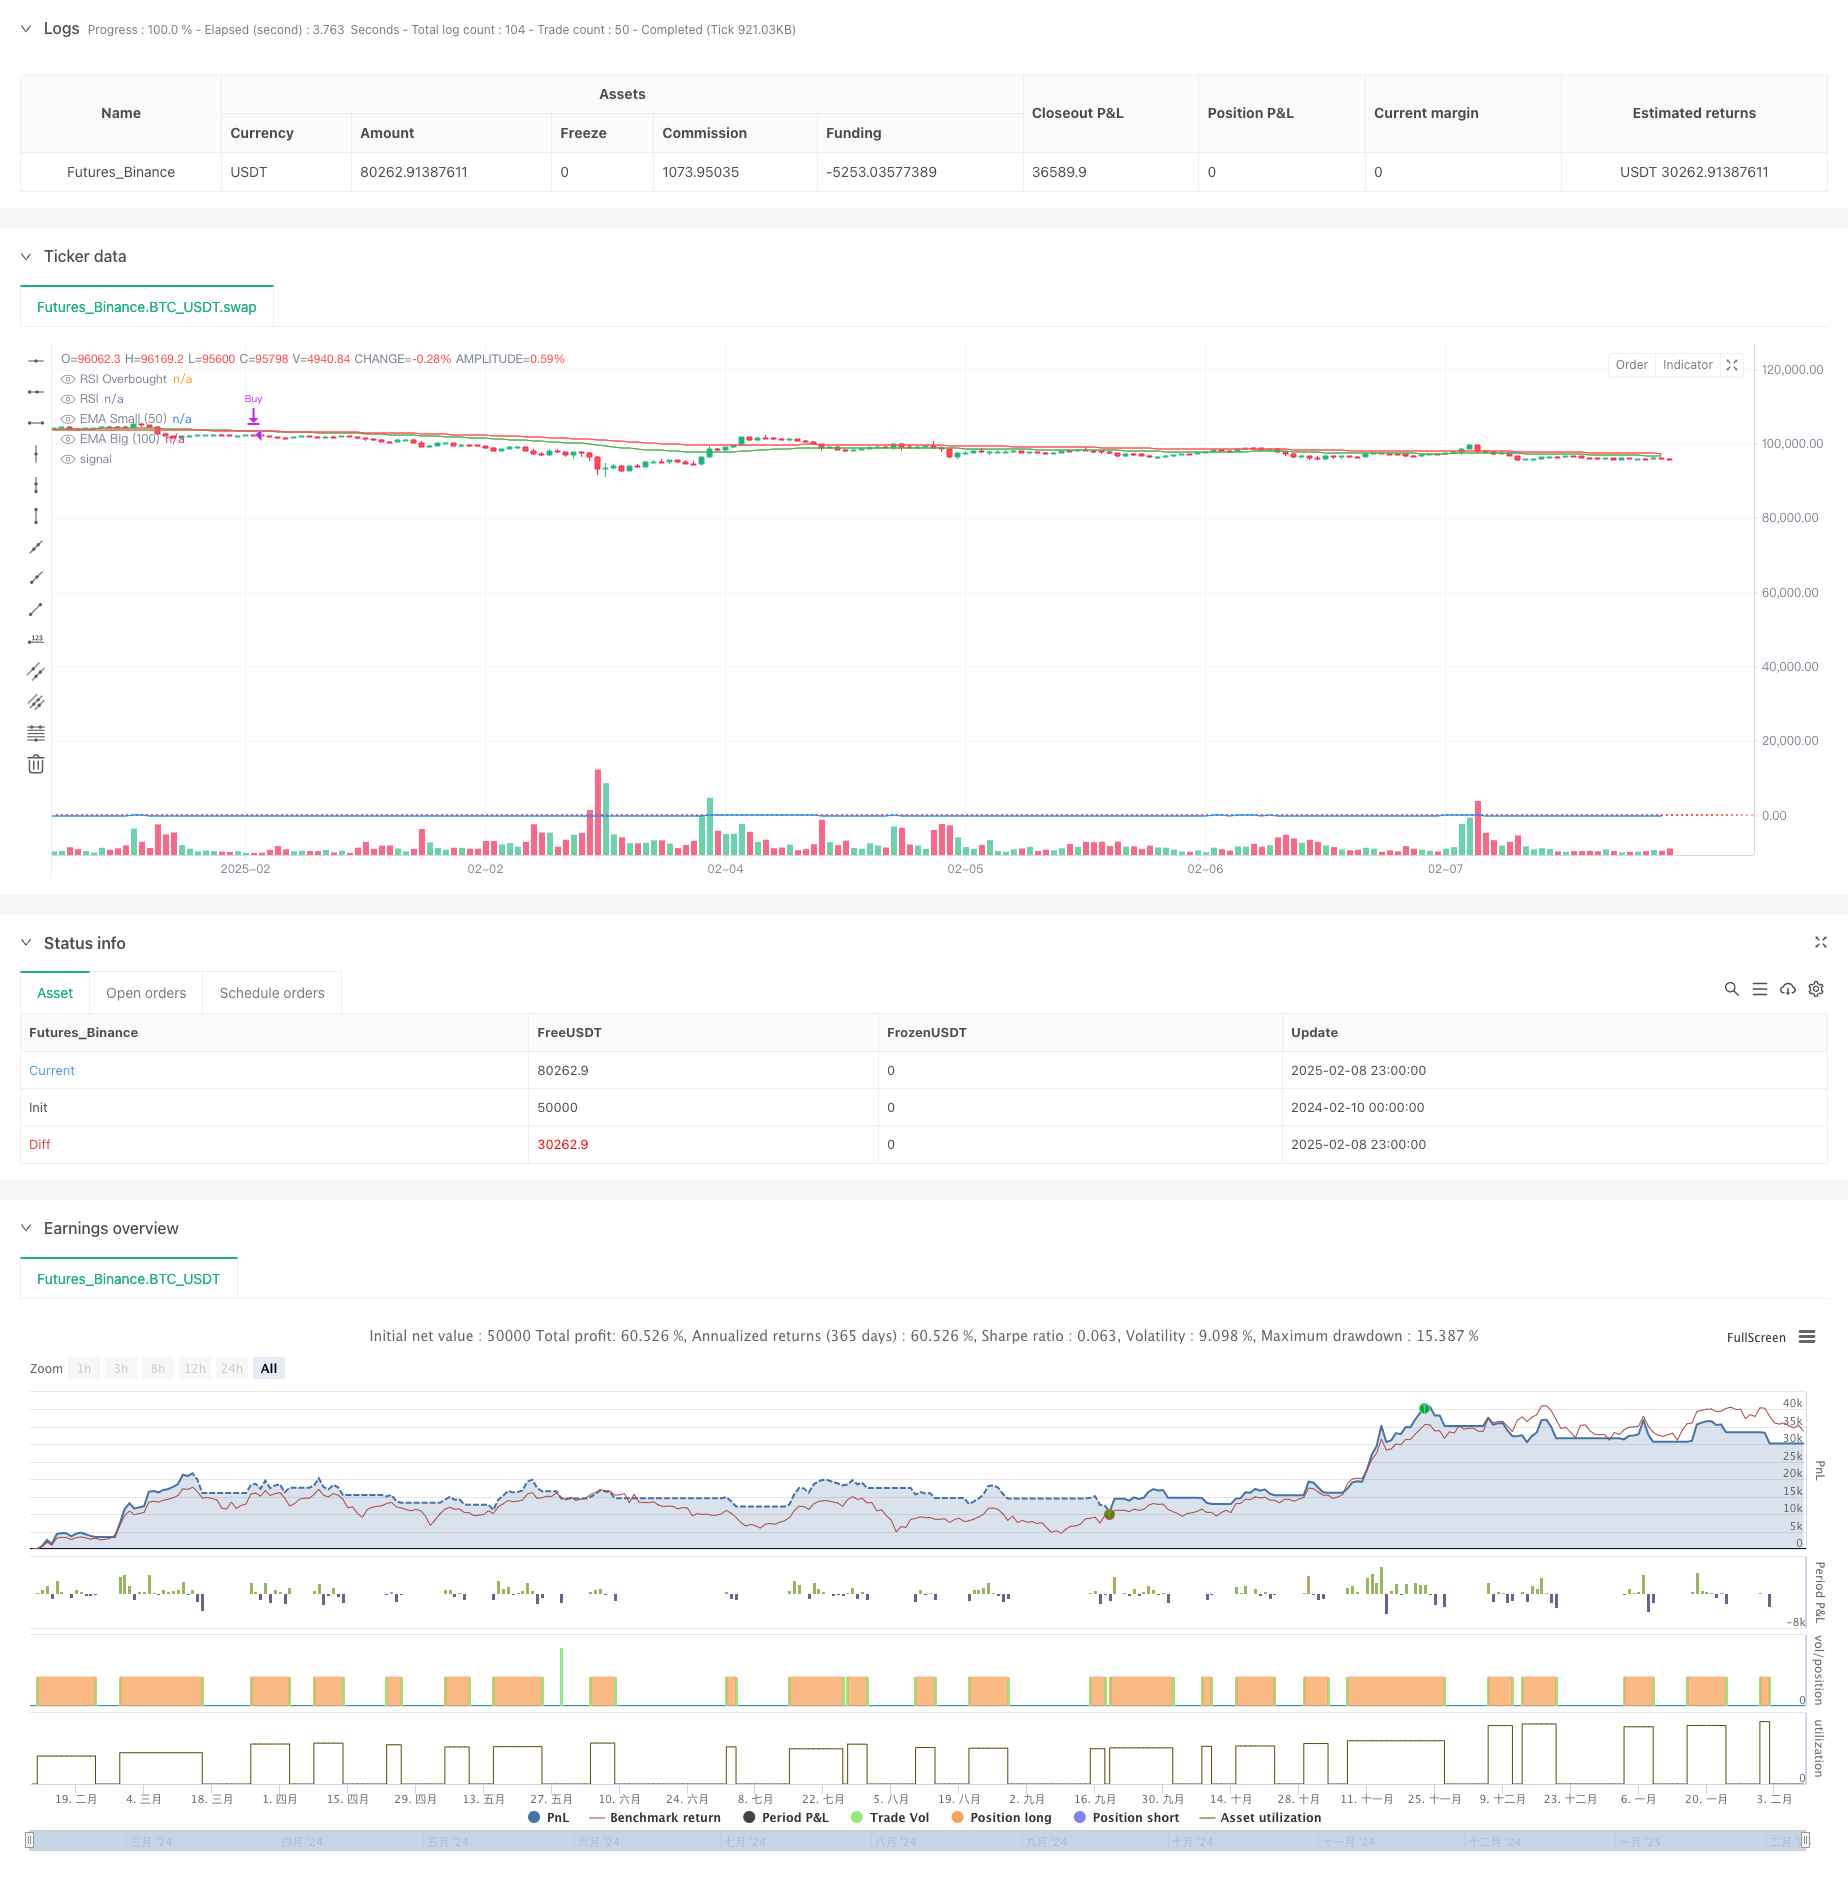
本策略是一个结合了双均线系统(50和100周期EMA)和RSI动量指标的交易系统。策略通过识别均线交叉和RSI超买区域来确定市场趋势和入场时机,同时使用动态止损来控制风险。该策略主要适用于趋势明显的市场环境,通过捕捉趋势的持续性来获取收益。
|
||
|
|
|
||
|
|
#### 策略原理
|
||
|
|
策略的核心逻辑包含以下几个关键要素:
|
||
|
|
1. 使用50周期和100周期的指数移动平均线(EMA)构建趋势判断系统
|
||
|
|
2. 通过RSI指标的超买区域(默认70)确认动量
|
||
|
|
3. 在均线金叉且RSI进入超买区域时进场做多
|
||
|
|
4. 当短期均线跌破长期均线时平仓出场
|
||
|
|
5. 使用均线交叉点设置动态止损位
|
||
|
|
|
||
|
|
#### 策略优势
|
||
|
|
1. 结合趋势和动量双重确认,提高交易信号的可靠性
|
||
|
|
2. 使用经典技术指标,逻辑清晰,易于理解和执行
|
||
|
|
3. 动态止损机制可以有效控制风险,防止过度回撤
|
||
|
|
4. 策略参数可调整性强,适应不同市场环境
|
||
|
|
5. 代码结构清晰,便于维护和优化
|
||
|
|
|
||
|
|
#### 策略风险
|
||
|
|
1. 在震荡市场中可能产生频繁的假突破信号
|
||
|
|
2. RSI超买条件可能导致错过一些重要的趋势起点
|
||
|
|
3. 均线系统存在滞后性,可能影响入场和出场时机
|
||
|
|
4. 市场剧烈波动时止损位可能不够及时
|
||
|
|
5. 仅支持做多,限制了策略的适用范围
|
||
|
|
|
||
|
|
#### 策略优化方向
|
||
|
|
1. 增加市场环境识别机制,在不同市场条件下使用不同的参数设置
|
||
|
|
2. 引入成交量指标作为辅助确认
|
||
|
|
3. 优化止损机制,考虑引入追踪止损
|
||
|
|
4. 添加做空机制,提高策略的全面性
|
||
|
|
5. 考虑加入波动率过滤器,避免在过度波动时期交易
|
||
|
|
6. 引入仓位管理系统,根据市场风险动态调整持仓量
|
||
|
|
|
||
|
|
#### 总结
|
||
|
|
这是一个基于经典技术分析理论构建的趋势跟踪策略,通过均线系统和RSI指标的配合使用,有效地平衡了盈利机会和风险控制。策略的主要优势在于逻辑清晰、风险可控,但也需要在实际应用中根据市场情况进行适当的参数优化和策略改进。对于寻求中长期趋势交易机会的投资者来说,这是一个值得参考的基础策略框架。 ||
|
||
|
|
|
||
|
|
#### Overview
|
||
|
|
This strategy combines a dual EMA system (50 and 100 periods) with the RSI momentum indicator. It identifies market trends and entry points through EMA crossovers and RSI overbought conditions, while implementing dynamic stop-loss for risk management. The strategy is particularly effective in trending market conditions, capitalizing on trend continuation patterns.
|
||
|
|
|
||
|
|
#### Strategy Principles
|
||
|
|
The core logic includes the following key elements:
|
||
|
|
1. Uses 50-period and 100-period Exponential Moving Averages (EMA) for trend identification
|
||
|
|
2. Confirms momentum using RSI overbought levels (default 70)
|
||
|
|
3. Enters long positions when EMAs cross bullishly and RSI enters overbought territory
|
||
|
|
4. Exits positions when the shorter EMA crosses below the longer EMA
|
||
|
|
5. Sets dynamic stop-loss at EMA crossover points
|
||
|
|
|
||
|
|
#### Strategy Advantages
|
||
|
|
1. Combines trend and momentum confirmation for improved signal reliability
|
||
|
|
2. Uses classic technical indicators, making it clear and easy to understand
|
||
|
|
3. Dynamic stop-loss mechanism effectively controls risk and prevents excessive drawdowns
|
||
|
|
4. Highly adjustable parameters for different market conditions
|
||
|
|
5. Clean code structure for easy maintenance and optimization
|
||
|
|
|
||
|
|
#### Strategy Risks
|
||
|
|
1. May generate frequent false breakout signals in ranging markets
|
||
|
|
2. RSI overbought condition might cause missing important trend initiations
|
||
|
|
3. EMA system has inherent lag, potentially affecting entry and exit timing
|
||
|
|
4. Stop-loss positioning might not be responsive enough in highly volatile markets
|
||
|
|
5. Limited to long positions, restricting strategy versatility
|
||
|
|
|
||
|
|
#### Strategy Optimization Directions
|
||
|
|
1. Implement market condition recognition for adaptive parameter settings
|
||
|
|
2. Incorporate volume indicators for additional confirmation
|
||
|
|
3. Enhance stop-loss mechanism with trailing stops
|
||
|
|
4. Add short-selling capability for comprehensive market coverage
|
||
|
|
5. Include volatility filters to avoid excessive market volatility
|
||
|
|
6. Introduce position sizing system based on market risk assessment
|
||
|
|
|
||
|
|
#### Summary
|
||
|
|
This trend-following strategy, built on classical technical analysis principles, effectively balances profit opportunities and risk control through the combination of EMA system and RSI indicator. Its main strengths lie in its clear logic and controllable risk, though it requires appropriate parameter optimization and strategy improvements based on market conditions. For investors seeking medium to long-term trend trading opportunities, this serves as a valuable basic strategy framework.[/trans]
|
||
|
|
|
||
|
|
|
||
|
|
|
||
|
|
> Source (PineScript)
|
||
|
|
|
||
|
|
``` pinescript
|
||
|
|
/*backtest
|
||
|
|
start: 2024-02-10 00:00:00
|
||
|
|
end: 2025-02-09 00:00:00
|
||
|
|
period: 1h
|
||
|
|
basePeriod: 1h
|
||
|
|
exchanges: [{"eid":"Futures_Binance","currency":"BTC_USDT"}]
|
||
|
|
*/
|
||
|
|
|
||
|
|
//@version=5
|
||
|
|
strategy("IME-Bands with RSI Strategy", overlay=true)
|
||
|
|
|
||
|
|
// === INPUTS ===
|
||
|
|
src = close
|
||
|
|
emaS_value = input.int(50, minval=1, title="EMA Small - Value") // 50 EMA
|
||
|
|
emaB_value = input.int(100, minval=1, title="EMA Big - Value") // 100 EMA
|
||
|
|
rsi_length = input.int(14, title="RSI Length")
|
||
|
|
rsi_source = input.source(close, title="RSI Source")
|
||
|
|
rsi_overbought = input.int(70, title="RSI Overbought Level")
|
||
|
|
rsi_oversold = input.int(30, title="RSI Oversold Level")
|
||
|
|
|
||
|
|
// === CALCULATIONS ===
|
||
|
|
// EMAs
|
||
|
|
emaS = ta.ema(close, emaS_value)
|
||
|
|
emaB = ta.ema(close, emaB_value)
|
||
|
|
|
||
|
|
// RSI
|
||
|
|
rsi = ta.rsi(rsi_source, rsi_length)
|
||
|
|
|
||
|
|
// IME-Band Cross Conditions
|
||
|
|
isGreenCrossover = emaS > emaB // Green band
|
||
|
|
isRedCrossover = emaS < emaB // Red band
|
||
|
|
|
||
|
|
// Track Green Cross Confirmation
|
||
|
|
var bool isGreenConfirmed = false
|
||
|
|
if (isGreenCrossover and not isGreenCrossover[1]) // First green crossover
|
||
|
|
isGreenConfirmed := true
|
||
|
|
|
||
|
|
if (not isGreenCrossover)
|
||
|
|
isGreenConfirmed := false
|
||
|
|
|
||
|
|
// Entry Condition: RSI above 70 on second green candle
|
||
|
|
entryCondition = isGreenConfirmed and rsi > rsi_overbought and isGreenCrossover
|
||
|
|
|
||
|
|
// Exit Condition: Red band confirmed
|
||
|
|
exitCondition = isRedCrossover
|
||
|
|
|
||
|
|
// === STRATEGY RULES ===
|
||
|
|
// Stop Loss: Lowest point of crossover
|
||
|
|
var float stopLoss = na
|
||
|
|
if (isGreenCrossover and not isGreenCrossover[1])
|
||
|
|
stopLoss := emaB // Set stop loss to EMA Big (crossover point)
|
||
|
|
|
||
|
|
// Entry and Exit Trades
|
||
|
|
if (entryCondition)
|
||
|
|
strategy.entry("Buy", strategy.long)
|
||
|
|
stopLoss := na // Reset stop loss after entry
|
||
|
|
|
||
|
|
if (exitCondition)
|
||
|
|
strategy.close("Buy")
|
||
|
|
|
||
|
|
// Stop Loss logic
|
||
|
|
if (strategy.position_size > 0 and not na(stopLoss))
|
||
|
|
strategy.exit("Stop Loss", from_entry="Buy", stop=stopLoss)
|
||
|
|
|
||
|
|
// Plotting
|
||
|
|
plot(emaS, color=color.green, title="EMA Small (50)", linewidth=1)
|
||
|
|
plot(emaB, color=color.red, title="EMA Big (100)", linewidth=1)
|
||
|
|
hline(rsi_overbought, "RSI Overbought", color=color.new(color.red, 70), linestyle=hline.style_dotted)
|
||
|
|
plot(rsi, color=color.blue, title="RSI")
|
||
|
|
|
||
|
|
```
|
||
|
|
|
||
|
|
> Detail
|
||
|
|
|
||
|
|
https://www.fmz.com/strategy/481393
|
||
|
|
|
||
|
|
> Last Modified
|
||
|
|
|
||
|
|
2025-02-10 16:54:48
|