151 lines
8.1 KiB
Markdown
151 lines
8.1 KiB
Markdown

|
|
||
|
|
> Name
|
||
|
|
|
||
|
|
双均线-RSI多重信号趋势交易策略-Dual-Moving-Average-RSI-Multi-Signal-Trend-Trading-Strategy
|
||
|
|
|
||
|
|
> Author
|
||
|
|
|
||
|
|
ChaoZhang
|
||
|
|
|
||
|
|
> Strategy Description
|
||
|
|
|
||
|
|
|
||
|
|
|
||
|
|
[trans]
|
||
|
|
#### 概述
|
||
|
|
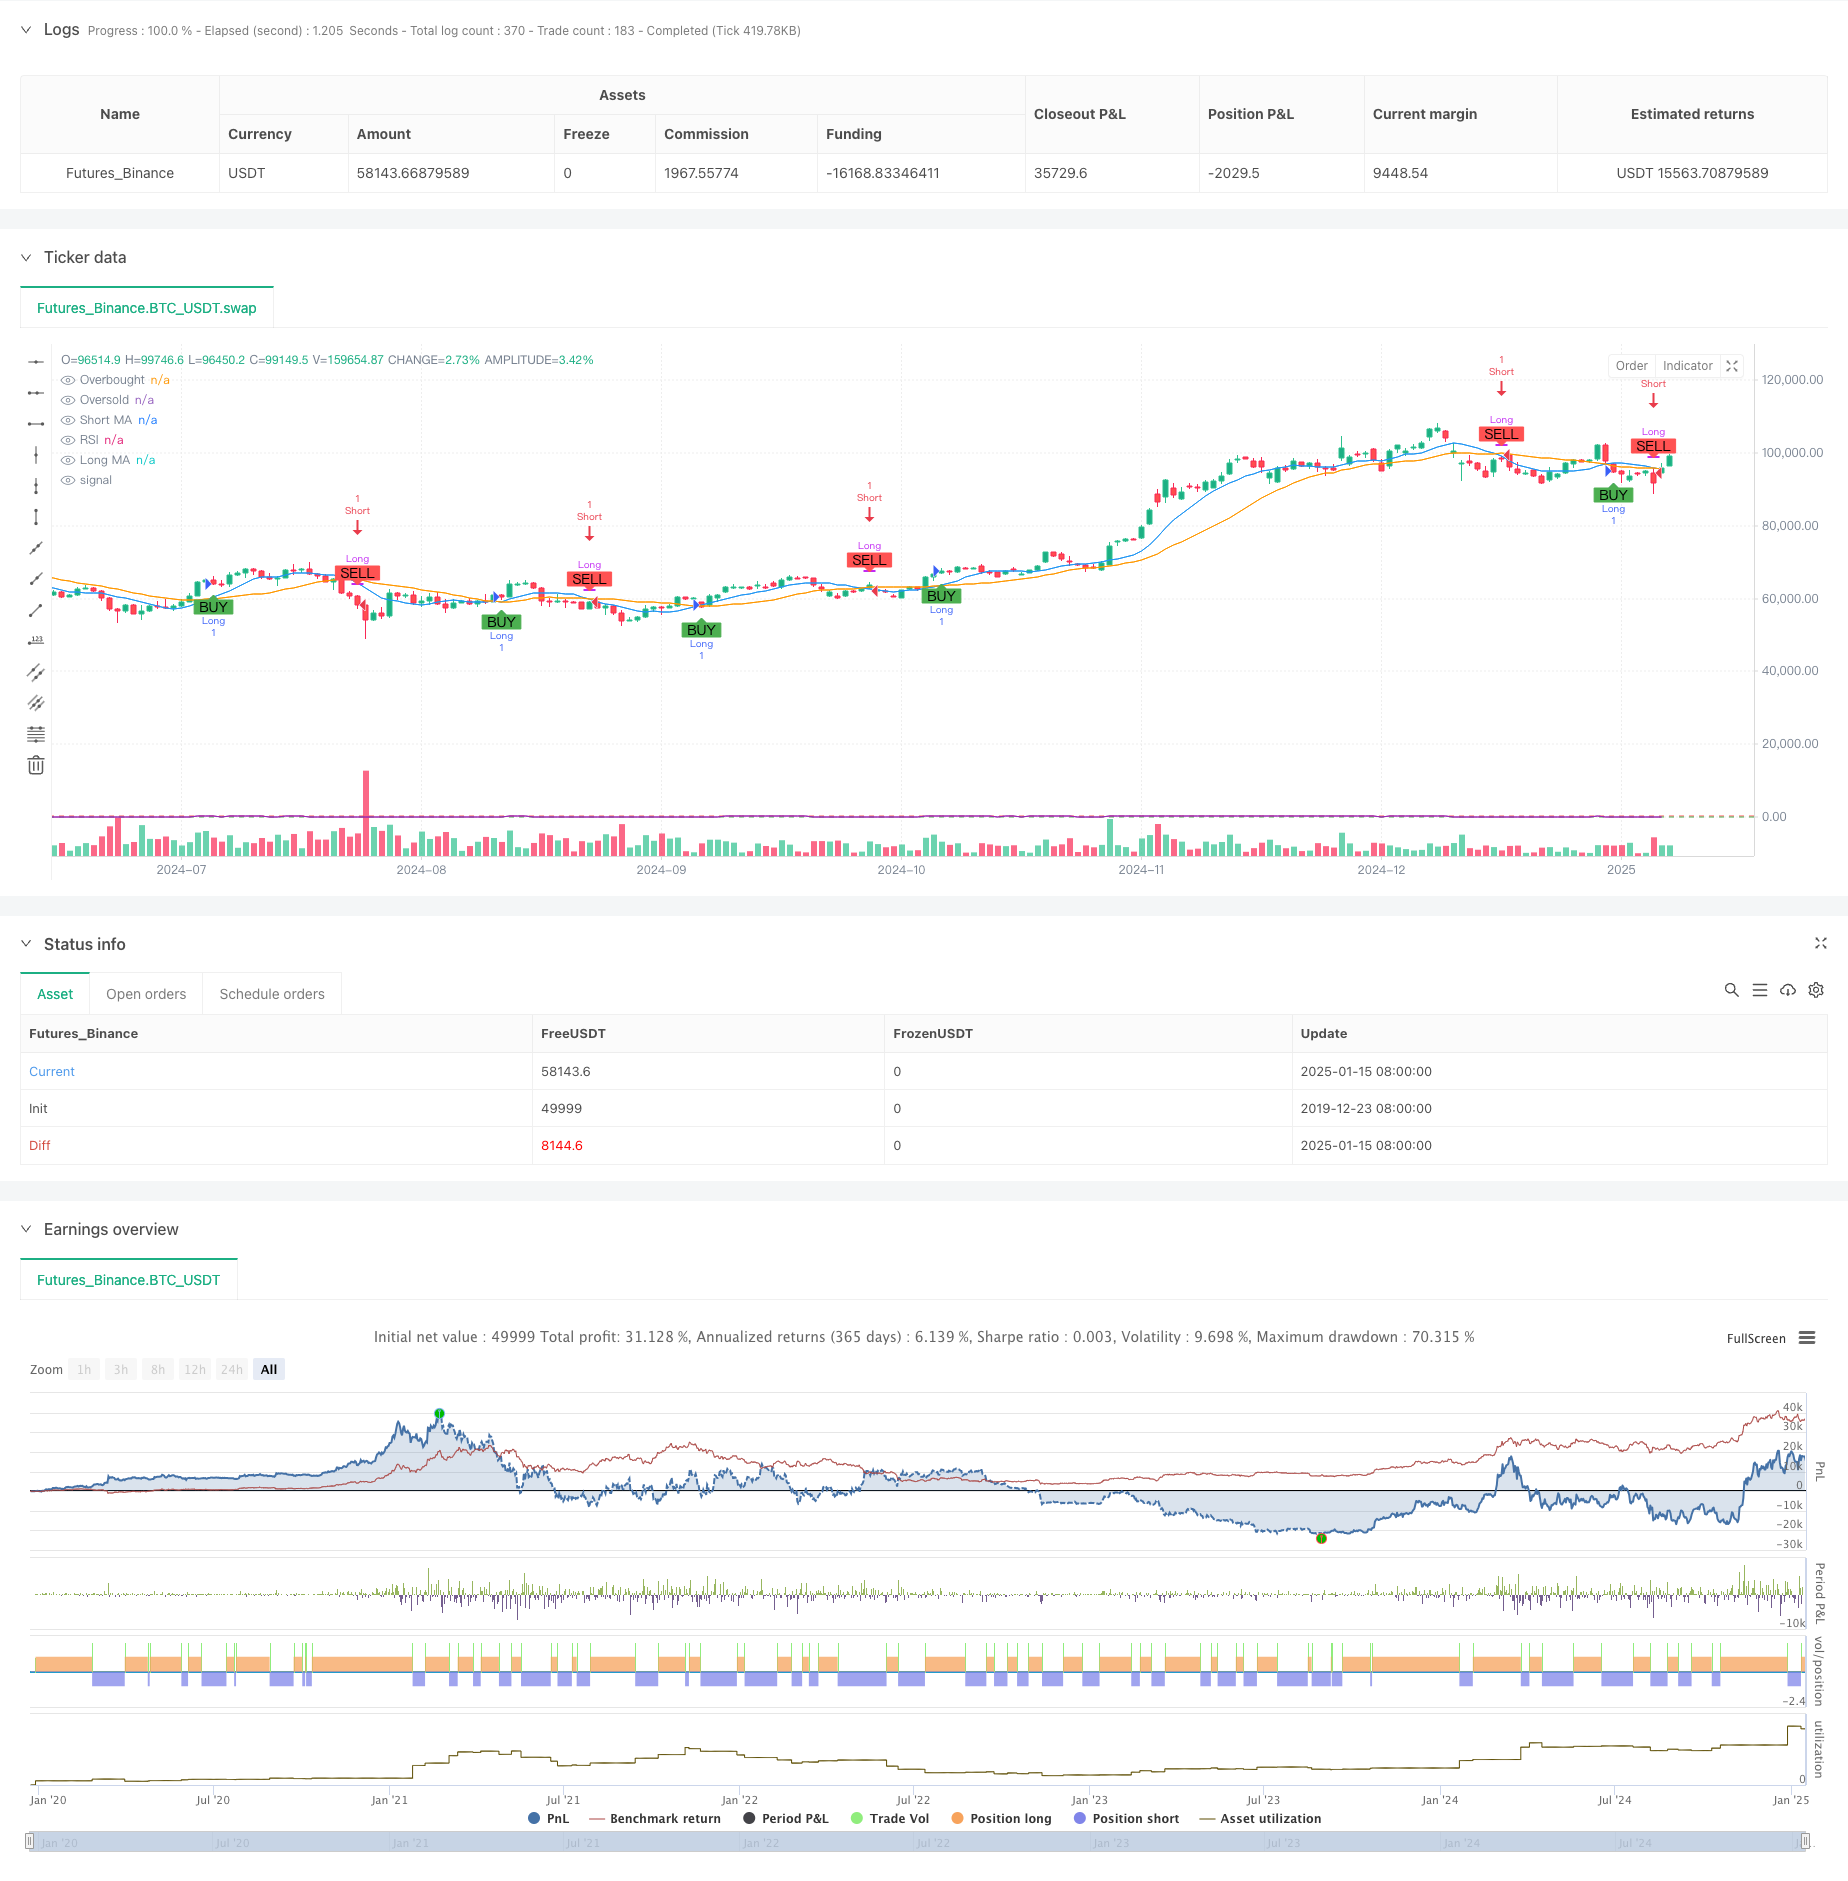
本策略是一个基于双均线和相对强弱指标(RSI)的多重信号趋势跟踪系统。策略在1小时时间周期上运行,通过短期和长期移动平均线的交叉以及RSI超买超卖水平来确定市场趋势和交易时机。系统采用9周期和21周期的简单移动平均线(SMA)组合,配合14周期的RSI指标,构建了一个完整的趋势跟踪和动量确认交易系统。
|
||
|
|
|
||
|
|
#### 策略原理
|
||
|
|
策略的核心逻辑基于以下几个关键要素:
|
||
|
|
1. 使用9周期和21周期的简单移动平均线来识别趋势方向,短期均线上穿长期均线形成做多信号,下穿形成做空信号。
|
||
|
|
2. 引入RSI指标作为趋势确认工具,设定70和30作为超买超卖阈值。
|
||
|
|
3. 在均线交叉信号出现时,系统会检查RSI值是否满足相应条件:做多要求RSI大于超卖水平(30),做空要求RSI小于超买水平(70)。
|
||
|
|
4. 当同时满足均线交叉和RSI条件时,系统才会执行相应的交易信号。
|
||
|
|
|
||
|
|
#### 策略优势
|
||
|
|
1. 多重信号确认机制显著提高了交易可靠性,避免了单一指标可能带来的虚假信号。
|
||
|
|
2. 结合趋势和动量指标,既能捕捉趋势,又能规避过度追涨杀跌。
|
||
|
|
3. 参数设置合理,9和21周期的均线组合能够有效平衡灵敏度和稳定性。
|
||
|
|
4. 系统自动在图表上显示交易信号,便于交易者直观判断。
|
||
|
|
5. 代码结构清晰,易于维护和优化。
|
||
|
|
|
||
|
|
#### 策略风险
|
||
|
|
1. 在震荡市场中可能产生频繁的交叉信号,导致过度交易。
|
||
|
|
2. RSI指标在强趋势市场中可能错过部分行情。
|
||
|
|
3. 固定的超买超卖阈值可能不适用于所有市场环境。
|
||
|
|
4. 均线系统存在一定滞后性,可能导致入场或出场时机略有延迟。
|
||
|
|
|
||
|
|
#### 策略优化方向
|
||
|
|
1. 引入自适应参数机制,根据市场波动率动态调整均线周期和RSI阈值。
|
||
|
|
2. 增加趋势强度过滤器,在震荡市场中降低交易频率。
|
||
|
|
3. 可以考虑加入止损和止盈机制,提高风险管理能力。
|
||
|
|
4. 引入成交量指标作为辅助确认信号。
|
||
|
|
5. 开发市场环境识别模块,在不同市场状态下使用不同的参数设置。
|
||
|
|
|
||
|
|
#### 总结
|
||
|
|
该策略通过结合均线系统和RSI指标,构建了一个相对完善的趋势跟踪交易系统。策略设计理念注重信号可靠性和风险控制,适合中长期趋势交易。虽然存在一些固有的局限性,但通过建议的优化方向,策略的整体性能有望得到进一步提升。策略的代码实现专业规范,具有良好的可扩展性,是一个值得深入研究和实践的交易系统。 ||
|
||
|
|
|
||
|
|
#### Overview
|
||
|
|
This strategy is a multi-signal trend following system based on dual moving averages and the Relative Strength Index (RSI). Operating on a 1-hour timeframe, it identifies market trends and trading opportunities through crossovers of short-term and long-term moving averages, combined with RSI overbought and oversold levels. The system employs a combination of 9-period and 21-period Simple Moving Averages (SMA) along with a 14-period RSI to create a comprehensive trend following and momentum confirmation trading system.
|
||
|
|
|
||
|
|
#### Strategy Principle
|
||
|
|
The core logic of the strategy is based on the following key elements:
|
||
|
|
1. Uses 9-period and 21-period Simple Moving Averages to identify trend direction, with long signals generated when the short MA crosses above the long MA, and short signals when it crosses below.
|
||
|
|
2. Incorporates RSI as a trend confirmation tool, with 70 and 30 set as overbought and oversold thresholds.
|
||
|
|
3. When moving average crossovers occur, the system checks if RSI values meet corresponding conditions: long positions require RSI above oversold level (30), short positions require RSI below overbought level (70).
|
||
|
|
4. Trades are executed only when both moving average crossover and RSI conditions are satisfied simultaneously.
|
||
|
|
|
||
|
|
#### Strategy Advantages
|
||
|
|
1. Multiple signal confirmation mechanism significantly improves trading reliability, avoiding false signals from single indicators.
|
||
|
|
2. Combination of trend and momentum indicators enables both trend capture and avoidance of excessive momentum chasing.
|
||
|
|
3. Reasonable parameter settings, with 9 and 21-period moving average combination effectively balancing sensitivity and stability.
|
||
|
|
4. System automatically displays trading signals on the chart for intuitive judgment.
|
||
|
|
5. Clear code structure, easy to maintain and optimize.
|
||
|
|
|
||
|
|
#### Strategy Risks
|
||
|
|
1. May generate frequent crossover signals in ranging markets, leading to overtrading.
|
||
|
|
2. RSI indicator might miss some opportunities in strong trend markets.
|
||
|
|
3. Fixed overbought and oversold thresholds may not be suitable for all market conditions.
|
||
|
|
4. Moving average system has inherent lag, potentially causing delayed entry or exit timing.
|
||
|
|
|
||
|
|
#### Strategy Optimization Directions
|
||
|
|
1. Introduce adaptive parameter mechanisms to dynamically adjust moving average periods and RSI thresholds based on market volatility.
|
||
|
|
2. Add trend strength filters to reduce trading frequency in ranging markets.
|
||
|
|
3. Consider implementing stop-loss and take-profit mechanisms to improve risk management.
|
||
|
|
4. Incorporate volume indicators as auxiliary confirmation signals.
|
||
|
|
5. Develop market environment recognition modules to use different parameter settings under different market conditions.
|
||
|
|
|
||
|
|
#### Summary
|
||
|
|
This strategy constructs a relatively complete trend following trading system by combining moving average systems with RSI indicators. The strategy design philosophy emphasizes signal reliability and risk control, suitable for medium to long-term trend trading. While there are some inherent limitations, the overall performance of the strategy can be further improved through the suggested optimization directions. The code implementation is professional and standardized, with good scalability, making it a trading system worthy of in-depth study and practice.[/trans]
|
||
|
|
|
||
|
|
|
||
|
|
|
||
|
|
> Source (PineScript)
|
||
|
|
|
||
|
|
``` pinescript
|
||
|
|
/*backtest
|
||
|
|
start: 2019-12-23 08:00:00
|
||
|
|
end: 2025-01-16 00:00:00
|
||
|
|
period: 1d
|
||
|
|
basePeriod: 1d
|
||
|
|
exchanges: [{"eid":"Futures_Binance","currency":"BTC_USDT","balance":49999}]
|
||
|
|
*/
|
||
|
|
|
||
|
|
// This Pine Script™ code is subject to the terms of the Mozilla Public License 2.0 at https://mozilla.org/MPL/2.0/
|
||
|
|
// © Vitaliby
|
||
|
|
|
||
|
|
//@version=5
|
||
|
|
strategy("Vitaliby MA and RSI Strategy", overlay=true)
|
||
|
|
|
||
|
|
// Входные параметры для настройки
|
||
|
|
shortMALength = input.int(9, title="Short MA Length")
|
||
|
|
longMALength = input.int(21, title="Long MA Length")
|
||
|
|
rsiLength = input.int(14, title="RSI Length")
|
||
|
|
rsiOverbought = input.int(70, title="RSI Overbought Level")
|
||
|
|
rsiOversold = input.int(30, title="RSI Oversold Level")
|
||
|
|
|
||
|
|
// Расчет скользящих средних и RSI
|
||
|
|
shortMA = ta.sma(close, shortMALength)
|
||
|
|
longMA = ta.sma(close, longMALength)
|
||
|
|
rsi = ta.rsi(close, rsiLength)
|
||
|
|
|
||
|
|
// Определение условий для входа и выхода
|
||
|
|
longCondition = ta.crossover(shortMA, longMA) and rsi > rsiOversold
|
||
|
|
shortCondition = ta.crossunder(shortMA, longMA) and rsi < rsiOverbought
|
||
|
|
|
||
|
|
// Отображение сигналов на графике
|
||
|
|
plotshape(series=longCondition, location=location.belowbar, color=color.green, style=shape.labelup, text="BUY", size=size.small)
|
||
|
|
plotshape(series=shortCondition, location=location.abovebar, color=color.red, style=shape.labeldown, text="SELL", size=size.small)
|
||
|
|
|
||
|
|
// Отображение скользящих средних на графике
|
||
|
|
plot(shortMA, color=color.blue, title="Short MA")
|
||
|
|
plot(longMA, color=color.orange, title="Long MA")
|
||
|
|
|
||
|
|
// Отображение RSI на отдельном окне
|
||
|
|
hline(rsiOverbought, "Overbought", color=color.red)
|
||
|
|
hline(rsiOversold, "Oversold", color=color.green)
|
||
|
|
plot(rsi, color=color.purple, title="RSI")
|
||
|
|
|
||
|
|
// Управление позициями
|
||
|
|
if (longCondition)
|
||
|
|
strategy.entry("Long", strategy.long)
|
||
|
|
|
||
|
|
if (shortCondition)
|
||
|
|
strategy.close("Long")
|
||
|
|
|
||
|
|
if (shortCondition)
|
||
|
|
strategy.entry("Short", strategy.short)
|
||
|
|
|
||
|
|
if (longCondition)
|
||
|
|
strategy.close("Short")
|
||
|
|
|
||
|
|
```
|
||
|
|
|
||
|
|
> Detail
|
||
|
|
|
||
|
|
https://www.fmz.com/strategy/478744
|
||
|
|
|
||
|
|
> Last Modified
|
||
|
|
|
||
|
|
2025-01-17 16:31:31
|