169 lines
8.3 KiB
Markdown
169 lines
8.3 KiB
Markdown

|
|
||
|
|
> Name
|
||
|
|
|
||
|
|
双周期移动平均线结合RSI动量和成交量的趋势跟踪策略-Dual-Period-Moving-Average-with-RSI-Momentum-and-Volume-Trend-Following-Strategy
|
||
|
|
|
||
|
|
> Author
|
||
|
|
|
||
|
|
ChaoZhang
|
||
|
|
|
||
|
|
> Strategy Description
|
||
|
|
|
||
|
|
|
||
|
|
|
||
|
|
[trans]
|
||
|
|
#### 概述
|
||
|
|
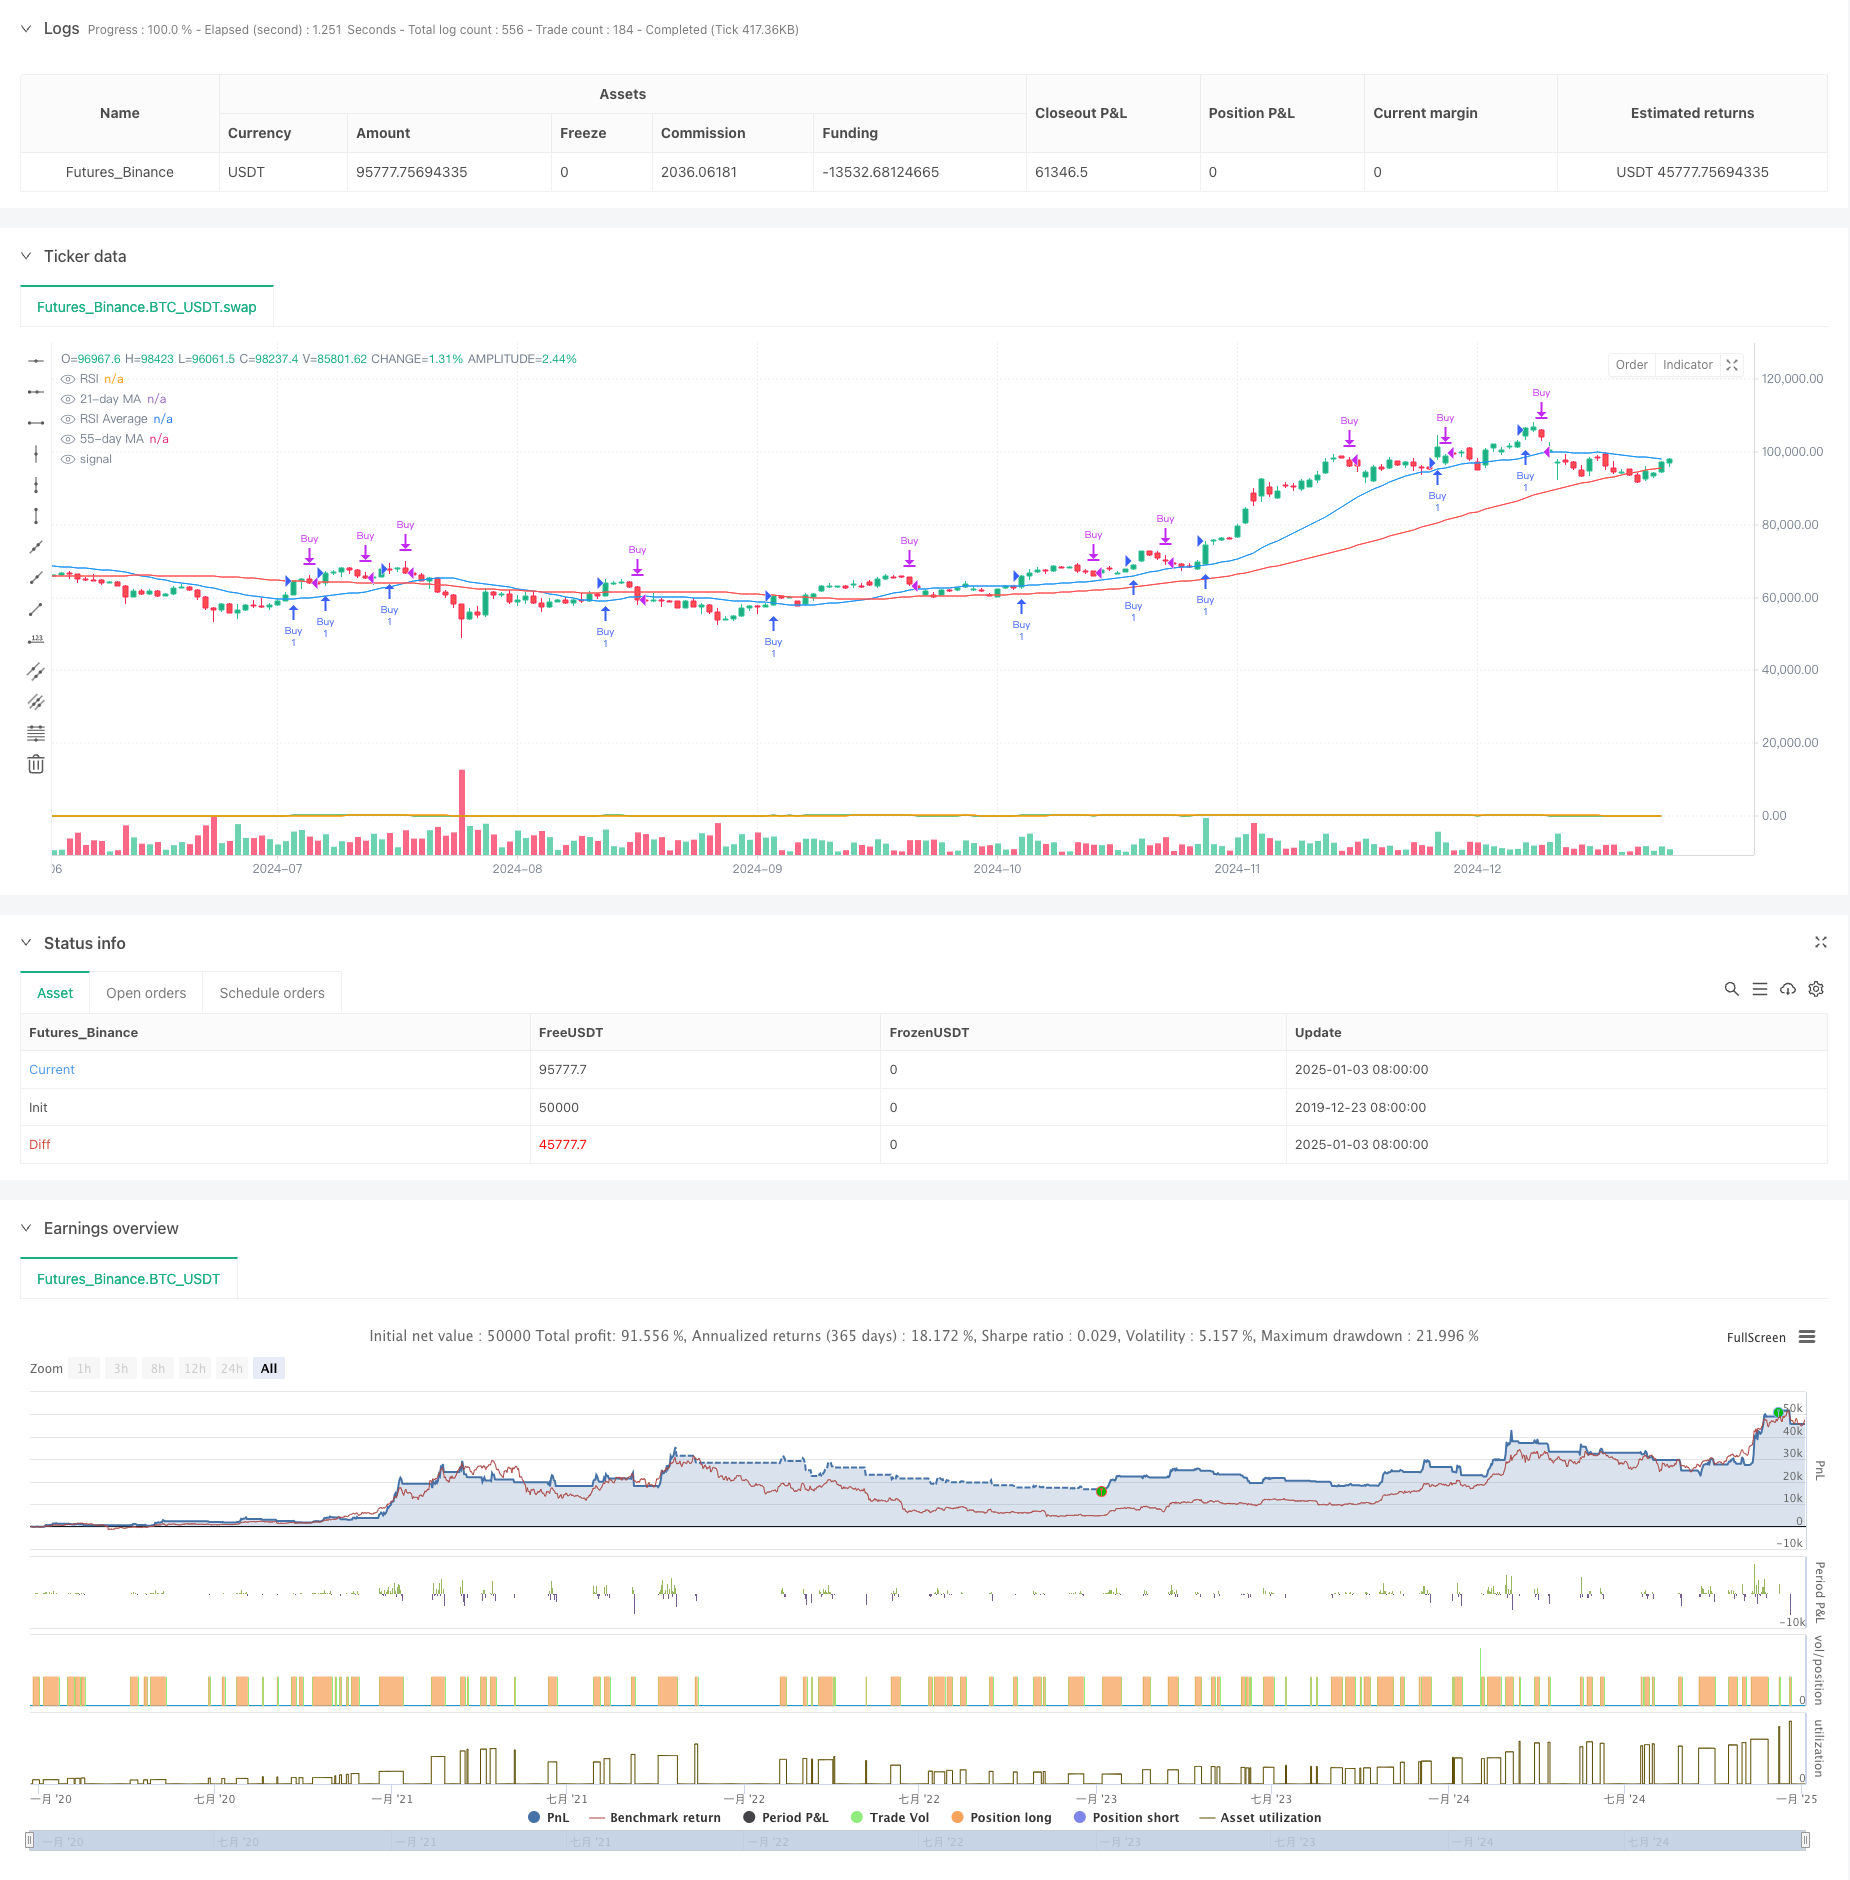
这是一个结合了双周期移动平均线(21日和55日)、RSI动量指标和成交量的趋势跟踪策略。该策略通过分析价格、动量和成交量三个维度的市场信息,在确认趋势方向的同时,通过RSI和成交量指标对交易信号进行过滤,以提高交易的准确性。策略在价格突破短期均线且RSI突破均线的同时,要求成交量放大,从而确认趋势的有效性。
|
||
|
|
|
||
|
|
#### 策略原理
|
||
|
|
策略采用了三重过滤机制:
|
||
|
|
1. 价格过滤:使用21日和55日两个周期的移动平均线来确认价格趋势,当收盘价站上21日均线时视为潜在的做多机会
|
||
|
|
2. 动量过滤:计算13周期的RSI指标及其13周期均线,当RSI突破其均线时确认动量方向
|
||
|
|
3. 成交量过滤:计算21周期的成交量移动平均线,要求在入场时成交量大于其均线值,确认市场参与度
|
||
|
|
|
||
|
|
买入条件需同时满足:
|
||
|
|
- 收盘价大于21日均线
|
||
|
|
- RSI大于其均线
|
||
|
|
- 成交量大于成交量均线
|
||
|
|
|
||
|
|
卖出条件满足以下任一即可:
|
||
|
|
- 价格跌破55日均线
|
||
|
|
- RSI跌破其均线
|
||
|
|
|
||
|
|
#### 策略优势
|
||
|
|
1. 多维度分析:通过价格、动量和成交量三个维度的综合分析,提高了信号的可靠性
|
||
|
|
2. 趋势确认:采用双周期移动平均线,能更好地确认趋势的方向和强度
|
||
|
|
3. 动态适应:RSI指标能够动态适应市场波动,帮助把握市场动量的变化
|
||
|
|
4. 量价配合:将成交量作为过滤条件,确保交易发生在市场活跃度较高的时期
|
||
|
|
5. 风险控制:设置了明确的止损条件,有助于控制风险
|
||
|
|
|
||
|
|
#### 策略风险
|
||
|
|
1. 滞后性风险:移动平均线本质上是滞后指标,可能导致入场和出场时机略有延迟
|
||
|
|
2. 震荡市风险:在横盘震荡市场中可能产生频繁的假突破信号
|
||
|
|
3. 参数敏感性:策略效果对参数设置较为敏感,不同市场环境可能需要调整参数
|
||
|
|
4. 成本风险:频繁交易可能带来较高的交易成本
|
||
|
|
5. 流动性风险:在低流动性市场中,可能难以按理想价格执行交易
|
||
|
|
|
||
|
|
#### 策略优化方向
|
||
|
|
1. 参数自适应:可以引入自适应机制,根据市场波动率动态调整移动平均线周期
|
||
|
|
2. 信号确认:可以添加趋势强度指标(如ADX),进一步过滤交易信号
|
||
|
|
3. 止盈优化:可以设计动态止盈机制,在强势行情中获取更多收益
|
||
|
|
4. 仓位管理:可以根据信号强度和市场波动率动态调整仓位大小
|
||
|
|
5. 时间过滤:可以加入交易时间窗口,避免在不利时段交易
|
||
|
|
|
||
|
|
#### 总结
|
||
|
|
这是一个综合运用技术分析三大要素(价格、成交量、动量)的趋势跟踪策略。通过多重过滤机制,策略在保证信号可靠性的同时,也具备了一定的风险控制能力。虽然存在一些固有的局限性,但通过持续优化和完善,该策略有望在实际交易中取得稳定的收益。特别是在趋势明确、流动性充足的市场中,策略的表现可能会更加理想。 ||
|
||
|
|
|
||
|
|
#### Overview
|
||
|
|
This is a trend-following strategy that combines dual-period moving averages (21-day and 55-day), RSI momentum indicator, and volume analysis. The strategy analyzes market information from three dimensions - price, momentum, and volume - while confirming trend direction and filtering trading signals through RSI and volume indicators to improve trading accuracy. The strategy requires price breakthrough of short-term moving average, RSI crossing above its average, and increased volume to confirm trend validity.
|
||
|
|
|
||
|
|
#### Strategy Principles
|
||
|
|
The strategy employs a triple-filtering mechanism:
|
||
|
|
1. Price Filter: Uses 21-day and 55-day moving averages to confirm price trends, with prices above 21-day MA indicating potential long opportunities
|
||
|
|
2. Momentum Filter: Calculates 13-period RSI and its 13-period average, confirming momentum direction when RSI crosses above its average
|
||
|
|
3. Volume Filter: Calculates 21-period volume moving average, requiring entry volume to exceed its average, confirming market participation
|
||
|
|
|
||
|
|
Buy conditions require all of the following:
|
||
|
|
- Close price above 21-day MA
|
||
|
|
- RSI above its average
|
||
|
|
- Volume above volume MA
|
||
|
|
|
||
|
|
Sell conditions require any of the following:
|
||
|
|
- Price falls below 55-day MA
|
||
|
|
- RSI falls below its average
|
||
|
|
|
||
|
|
#### Strategy Advantages
|
||
|
|
1. Multi-dimensional Analysis: Improves signal reliability through comprehensive analysis of price, momentum, and volume
|
||
|
|
2. Trend Confirmation: Dual-period moving averages better confirm trend direction and strength
|
||
|
|
3. Dynamic Adaptation: RSI indicator dynamically adapts to market volatility, helping capture momentum changes
|
||
|
|
4. Volume-Price Coordination: Uses volume as a filter condition, ensuring trades occur during periods of high market activity
|
||
|
|
5. Risk Control: Sets clear stop-loss conditions, helping control risk
|
||
|
|
|
||
|
|
#### Strategy Risks
|
||
|
|
1. Lag Risk: Moving averages are inherently lagging indicators, potentially causing delayed entry and exit
|
||
|
|
2. Range-bound Market Risk: May generate frequent false breakout signals in sideways markets
|
||
|
|
3. Parameter Sensitivity: Strategy effectiveness is sensitive to parameter settings, requiring adjustment in different market environments
|
||
|
|
4. Cost Risk: Frequent trading may incur high transaction costs
|
||
|
|
5. Liquidity Risk: May be difficult to execute trades at ideal prices in low-liquidity markets
|
||
|
|
|
||
|
|
#### Strategy Optimization Directions
|
||
|
|
1. Parameter Adaptation: Introduce adaptive mechanisms to dynamically adjust moving average periods based on market volatility
|
||
|
|
2. Signal Confirmation: Add trend strength indicators (like ADX) to further filter trading signals
|
||
|
|
3. Profit-Taking Optimization: Design dynamic profit-taking mechanisms to capture more gains in strong trends
|
||
|
|
4. Position Management: Dynamically adjust position sizes based on signal strength and market volatility
|
||
|
|
5. Time Filtering: Add trading time windows to avoid unfavorable trading periods
|
||
|
|
|
||
|
|
#### Summary
|
||
|
|
This is a trend-following strategy that comprehensively utilizes the three essential elements of technical analysis (price, volume, momentum). Through multiple filtering mechanisms, the strategy ensures signal reliability while maintaining risk control capabilities. Although it has some inherent limitations, through continuous optimization and improvement, the strategy has the potential to achieve stable returns in actual trading. The strategy may perform particularly well in markets with clear trends and sufficient liquidity.[/trans]
|
||
|
|
|
||
|
|
|
||
|
|
|
||
|
|
> Source (PineScript)
|
||
|
|
|
||
|
|
``` pinescript
|
||
|
|
/*backtest
|
||
|
|
start: 2019-12-23 08:00:00
|
||
|
|
end: 2025-01-04 08:00:00
|
||
|
|
period: 1d
|
||
|
|
basePeriod: 1d
|
||
|
|
exchanges: [{"eid":"Futures_Binance","currency":"BTC_USDT"}]
|
||
|
|
*/
|
||
|
|
|
||
|
|
//@version=5
|
||
|
|
strategy("21/55 MA with RSI Crossover", overlay=true)
|
||
|
|
|
||
|
|
// Inputs for moving averages
|
||
|
|
ma21_length = input.int(21, title="21-day Moving Average Length", minval=1)
|
||
|
|
ma55_length = input.int(55, title="55-day Moving Average Length", minval=1)
|
||
|
|
|
||
|
|
// RSI settings
|
||
|
|
rsi_length = input.int(13, title="RSI Length", minval=1)
|
||
|
|
rsi_avg_length = input.int(13, title="RSI Average Length", minval=1)
|
||
|
|
|
||
|
|
// Moving averages
|
||
|
|
ma21 = ta.sma(close, ma21_length)
|
||
|
|
ma55 = ta.sma(close, ma55_length)
|
||
|
|
|
||
|
|
// Volume settings
|
||
|
|
vol_ma_length = input.int(21, title="Volume MA Length", minval=1)
|
||
|
|
|
||
|
|
// Volume moving average
|
||
|
|
vol_ma = ta.sma(volume, vol_ma_length)
|
||
|
|
|
||
|
|
// RSI calculation
|
||
|
|
rsi = ta.rsi(close, rsi_length)
|
||
|
|
rsi_avg = ta.sma(rsi, rsi_avg_length)
|
||
|
|
|
||
|
|
// Buy condition
|
||
|
|
// buy_condition = close > ma21 and ta.crossover(rsi, rsi_avg) and volume > vol_ma
|
||
|
|
buy_condition = close > ma21 and rsi > rsi_avg and volume > vol_ma
|
||
|
|
|
||
|
|
// Sell condition
|
||
|
|
// sell_condition = close < ma55 or ta.crossunder(rsi, rsi_avg)
|
||
|
|
sell_condition = ta.crossunder(close, ma55) or ta.crossunder(rsi, rsi_avg)
|
||
|
|
|
||
|
|
// Execute trades
|
||
|
|
if (buy_condition)
|
||
|
|
strategy.entry("Buy", strategy.long, comment="Buy Signal")
|
||
|
|
|
||
|
|
if (sell_condition)
|
||
|
|
strategy.close("Buy", comment="Sell Signal")
|
||
|
|
|
||
|
|
// Plot moving averages for reference
|
||
|
|
plot(ma21, color=color.blue, title="21-day MA")
|
||
|
|
plot(ma55, color=color.red, title="55-day MA")
|
||
|
|
|
||
|
|
// Plot RSI and RSI average for reference
|
||
|
|
rsi_plot = input.bool(true, title="Show RSI?", inline="rsi")
|
||
|
|
plot(rsi_plot ? rsi : na, color=color.green, title="RSI")
|
||
|
|
plot(rsi_plot ? rsi_avg : na, color=color.orange, title="RSI Average")
|
||
|
|
```
|
||
|
|
|
||
|
|
> Detail
|
||
|
|
|
||
|
|
https://www.fmz.com/strategy/477551
|
||
|
|
|
||
|
|
> Last Modified
|
||
|
|
|
||
|
|
2025-01-06 13:45:16
|