280 lines
20 KiB
Markdown
280 lines
20 KiB
Markdown

|
|
||
|
|
> Name
|
||
|
|
|
||
|
|
动量驱动型布林带突破与智能资金概念融合策略-Momentum-Driven-Bollinger-Breakout-with-Smart-Money-Concepts-Integration-Strategy
|
||
|
|
|
||
|
|
> Author
|
||
|
|
|
||
|
|
ianzeng123
|
||
|
|
|
||
|
|
> Strategy Description
|
||
|
|
|
||
|
|
|
||
|
|
|
||
|
|
|
||
|
|
|
||
|
|
|
||
|
|
|
||
|
|
[trans]
|
||
|
|
|
||
|
|
#### 概述
|
||
|
|
|
||
|
|
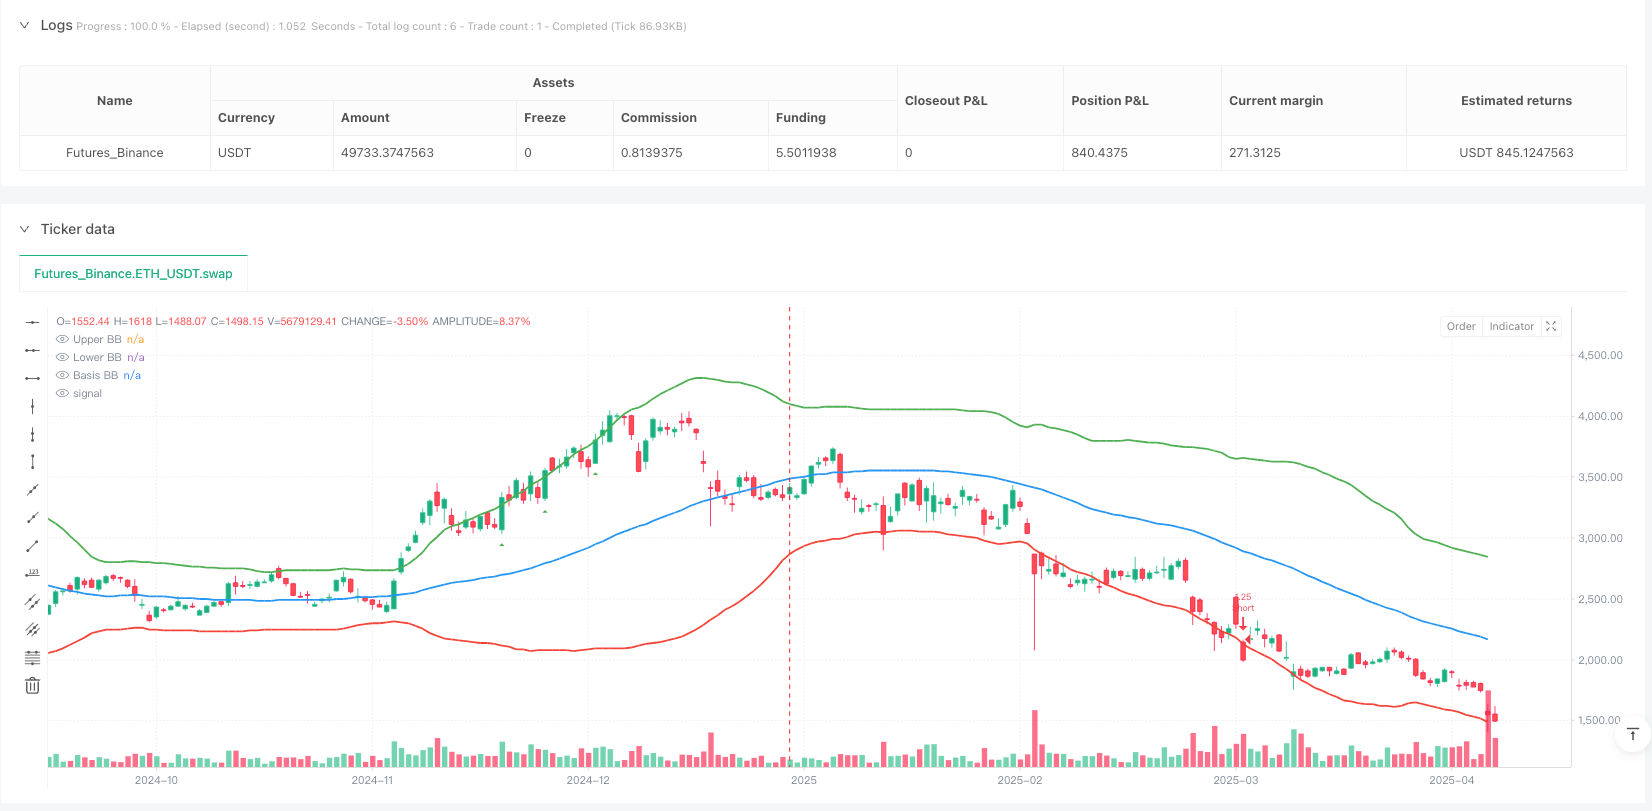
该策略是一种结合了智能资金概念(SMC)和布林带突破的量化交易系统,通过动量确认机制增强了交易信号的可靠性。策略的核心是识别价格突破布林带上下轨的情况,同时要求符合市场结构转换(MSS)信号,并可选择性地结合高时间周期趋势确认。此外,通过引入动量蜡烛过滤器,要求入场信号必须具备足够强度的价格动能,显著提高了策略的胜率和风险收益比。
|
||
|
|
|
||
|
|
#### 策略原理
|
||
|
|
|
||
|
|
该策略的运作基于三个核心技术组件的协同作用:
|
||
|
|
|
||
|
|
1. **布林带指标**:使用标准差来计算价格的波动范围,形成上轨、下轨和中轨。当价格突破上轨时产生做多信号,突破下轨时产生做空信号。本策略中布林带期间为55,标准差乘数为2.0。
|
||
|
|
|
||
|
|
2. **智能资金概念(SMC)**:
|
||
|
|
- 订单区块(Order Blocks):通过计算特定回溯期(默认20个周期)内的最高价和最低价,形成潜在的支撑与阻力区域。
|
||
|
|
- 流动性区域:通过识别近期的摇摆高点和低点(默认12个周期),确定市场中可能存在流动性的区域。
|
||
|
|
- 市场结构转换(MSS):当收盘价突破前期高点时,形成看涨的市场结构转换;当收盘价突破前期低点时,形成看跌的市场结构转换。
|
||
|
|
|
||
|
|
3. **动量确认机制**:要求入场蜡烛的实体部分占总高度的比例达到特定阈值(默认70%),确保价格突破具有足够的动能。看涨动量蜡烛呈现鲜明的绿色,看跌动量蜡烛呈现鲜明的红色。
|
||
|
|
|
||
|
|
入场条件:
|
||
|
|
- 做多条件:收盘价突破布林带上轨 + 看涨市场结构转换 + (可选)高时间周期处于上升趋势 + (可选)具备足够的看涨动量
|
||
|
|
- 做空条件:收盘价突破布林带下轨 + 看跌市场结构转换 + (可选)高时间周期处于下降趋势 + (可选)具备足够的看跌动量
|
||
|
|
|
||
|
|
出场条件:
|
||
|
|
- 做多出场:收盘价跌破布林带中轨或收盘价低于订单区块最低点的99%
|
||
|
|
- 做空出场:收盘价突破布林带中轨或收盘价高于订单区块最高点的101%
|
||
|
|
|
||
|
|
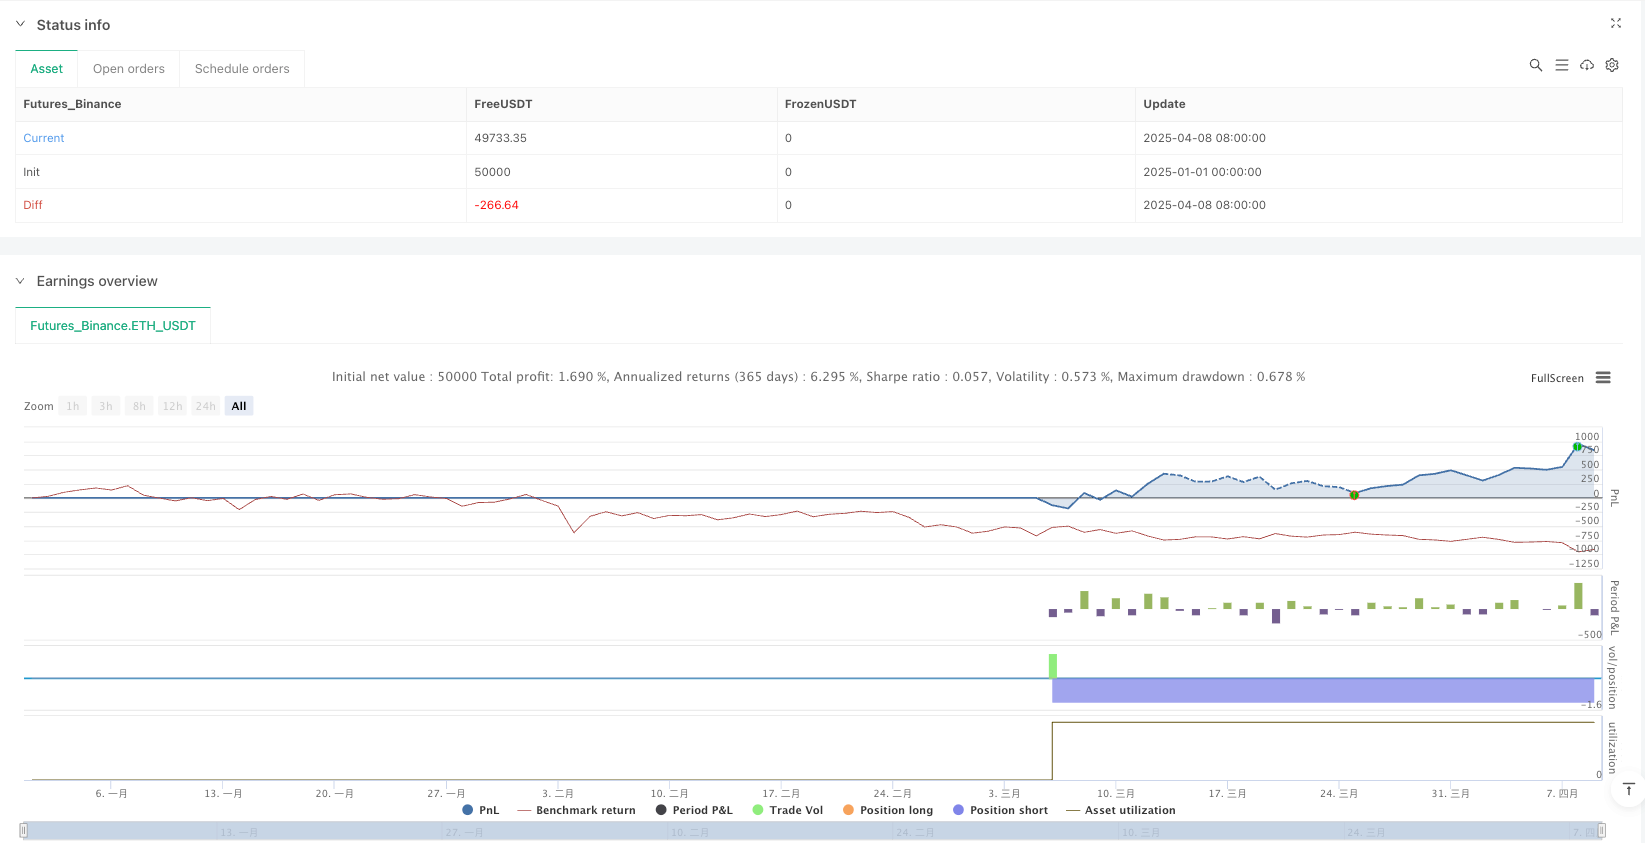
资金管理方面,策略采用基于账户净值的风险控制方法,每次交易限制在账户净值的5%,以控制单笔交易的最大风险敞口。
|
||
|
|
|
||
|
|
#### 策略优势
|
||
|
|
|
||
|
|
1. **多重确认机制**:通过结合布林带突破、市场结构转换和动量确认,形成多层次的交易信号过滤机制,显著减少虚假信号。
|
||
|
|
|
||
|
|
2. **趋势与动量结合**:策略不仅关注趋势变化(通过布林带和MSS),还重视价格动量(通过动量蜡烛),实现了趋势跟踪与动量捕捉的完美结合。
|
||
|
|
|
||
|
|
3. **时间周期协同**:可选的高时间周期趋势确认功能(默认为日线级别),有效避免了逆势交易,提高了顺势交易的成功率。
|
||
|
|
|
||
|
|
4. **视觉直观**:策略提供了清晰的视觉辅助,包括布林带、订单区块线、摇摆高低点线以及动量蜡烛的颜色标记,使交易者能够直观了解市场状态。
|
||
|
|
|
||
|
|
5. **灵活可调**:策略参数高度可定制,包括布林带长度、标准差乘数、订单区块回溯长度、摇摆回溯长度以及动量蜡烛阈值等,可适应不同市场环境。
|
||
|
|
|
||
|
|
6. **智能资金管理**:采用基于账户净值比例的仓位控制方法,有效管理风险,防止单笔交易造成过大损失。
|
||
|
|
|
||
|
|
#### 策略风险
|
||
|
|
|
||
|
|
1. **过度优化风险**:策略包含多个可调参数,如布林带长度(55)、标准差乘数(2.0)、回溯长度等,容易导致参数过度优化,产生曲线拟合问题。解决方法是在不同时间周期和市场环境下进行稳健性测试。
|
||
|
|
|
||
|
|
2. **滞后性问题**:布林带和SMC元素都基于历史数据计算,具有一定滞后性,可能导致入场时机不够理想。解决方法是结合价格行为分析和其他领先指标辅助判断。
|
||
|
|
|
||
|
|
3. **趋势反转风险**:在强烈的市场反转中,策略可能出现连续亏损。解决方法是增加趋势反转检测机制,或在极端市场条件下暂停交易。
|
||
|
|
|
||
|
|
4. **资金管理挑战**:固定5%的资金分配可能在波动性较大的市场中风险过高。解决方法是动态调整资金分配比例,根据市场波动性进行自适应调整。
|
||
|
|
|
||
|
|
5. **流动性风险**:在流动性较低的市场中,订单区块和流动性区域可能不够准确。解决方法是增加交易量确认机制,或仅在流动性充足的市场中应用该策略。
|
||
|
|
|
||
|
|
#### 策略优化方向
|
||
|
|
|
||
|
|
1. **动态参数调整**:可以引入自适应机制,根据市场波动率自动调整布林带的标准差乘数和长度参数,使策略更好地适应不同市场环境。这样可以解决静态参数在不同市场条件下表现不一的问题。
|
||
|
|
|
||
|
|
2. **增强趋势识别**:可以引入额外的趋势指标,如方向性移动指数(DMI)或平均方向性指数(ADX),进一步确认趋势强度,避免在弱势趋势市场中过度交易。
|
||
|
|
|
||
|
|
3. **改进出场机制**:当前出场机制相对简单,可以考虑引入尾随止损、移动平均线交叉或ATR倍数止损等更灵活的出场方式,以更好地保护利润。
|
||
|
|
|
||
|
|
4. **整合成交量分析**:在策略中加入成交量确认机制,要求价格突破伴随成交量的明显放大,进一步提高信号质量。成交量作为重要的市场参与度指标,能有效验证价格动量的真实性。
|
||
|
|
|
||
|
|
5. **引入时间过滤器**:市场在不同交易时段表现特征不同,可以添加时间过滤器,避免在特定的低效交易时段(如亚洲盘整理时段)产生信号。
|
||
|
|
|
||
|
|
6. **优化资金管理**:可以引入基于ATR的仓位计算方法,根据市场波动性动态调整风险敞口,在高波动市场减少暴露,在低波动市场适当增加仓位。
|
||
|
|
|
||
|
|
#### 总结
|
||
|
|
|
||
|
|
动量驱动型布林带突破与智能资金概念融合策略是一个结合了技术分析和市场结构理论的综合交易系统。该策略通过布林带突破捕捉价格动量,利用SMC理论识别关键价格水平和市场结构变化,并通过动量蜡烛过滤器增强信号可靠性。多层次的信号确认机制显著减少了虚假信号,而可选的高时间周期趋势确认则有助于避免逆势交易。
|
||
|
|
|
||
|
|
尽管该策略具有明确的逻辑和多重优势,但交易者仍需意识到其潜在风险,包括参数优化风险、滞后性问题和趋势反转风险等。通过引入动态参数调整、增强趋势识别、改进出场机制和整合成交量分析等优化措施,可以进一步提升策略的稳健性和适应性。
|
||
|
|
|
||
|
|
最终,交易者应记住,没有完美的交易策略,关键在于理解策略的核心逻辑,合理管理风险,并根据不同市场环境灵活调整。在实际应用前,建议进行充分的回测和前向测试,以验证策略在不同市场条件下的表现。 ||
|
||
|
|
|
||
|
|
#### Overview
|
||
|
|
|
||
|
|
This strategy combines Smart Money Concepts (SMC) with Bollinger Band breakouts, enhanced by a momentum confirmation mechanism to improve signal reliability. The core approach identifies price breakouts beyond Bollinger Bands while requiring Market Structure Shift (MSS) signals, with optional higher timeframe trend confirmation. By incorporating a momentum candle filter that requires entry signals to have sufficient price momentum, the strategy significantly improves win rates and risk-reward ratios.
|
||
|
|
|
||
|
|
#### Strategy Principles
|
||
|
|
|
||
|
|
The strategy operates through the synergistic action of three core technical components:
|
||
|
|
|
||
|
|
1. **Bollinger Bands Indicator**: Uses standard deviation to calculate price volatility range, forming upper, lower, and middle bands. When price breaks above the upper band, it generates a long signal; breaking below the lower band generates a short signal. In this strategy, the Bollinger Band period is 55 with a standard deviation multiplier of 2.0.
|
||
|
|
|
||
|
|
2. **Smart Money Concepts (SMC)**:
|
||
|
|
- Order Blocks: Calculates the highest high and lowest low within a specific lookback period (default 20 periods) to form potential support and resistance zones.
|
||
|
|
- Liquidity Zones: Identifies recent swing highs and lows (default 12 periods) to determine areas where market liquidity may exist.
|
||
|
|
- Market Structure Shift (MSS): When closing price breaks above a previous high, a bullish market structure shift forms; when closing price breaks below a previous low, a bearish market structure shift forms.
|
||
|
|
|
||
|
|
3. **Momentum Confirmation Mechanism**: Requires the entry candle's body to represent a specific percentage of its total height (default 70%), ensuring sufficient momentum behind the breakout. Bullish momentum candles display in bright green, while bearish momentum candles display in bright red.
|
||
|
|
|
||
|
|
Entry Conditions:
|
||
|
|
- Long Condition: Closing price breaks above the upper Bollinger Band + Bullish market structure shift + (Optional) Higher timeframe in uptrend + (Optional) Sufficient bullish momentum
|
||
|
|
- Short Condition: Closing price breaks below the lower Bollinger Band + Bearish market structure shift + (Optional) Higher timeframe in downtrend + (Optional) Sufficient bearish momentum
|
||
|
|
|
||
|
|
Exit Conditions:
|
||
|
|
- Long Exit: Closing price falls below the Bollinger Band middle line or closing price falls below 99% of the order block low
|
||
|
|
- Short Exit: Closing price breaks above the Bollinger Band middle line or closing price rises above 101% of the order block high
|
||
|
|
|
||
|
|
For money management, the strategy employs an equity-based risk control method, limiting each trade to 5% of account equity to control maximum risk exposure per trade.
|
||
|
|
|
||
|
|
#### Strategy Advantages
|
||
|
|
|
||
|
|
1. **Multiple Confirmation Mechanisms**: By combining Bollinger Band breakouts, market structure shifts, and momentum confirmation, a multi-level trade signal filtering mechanism is formed, significantly reducing false signals.
|
||
|
|
|
||
|
|
2. **Integration of Trend and Momentum**: The strategy focuses not only on trend changes (through Bollinger Bands and MSS) but also on price momentum (through momentum candles), achieving a perfect combination of trend following and momentum capture.
|
||
|
|
|
||
|
|
3. **Timeframe Synergy**: The optional higher timeframe trend confirmation feature (default daily level) effectively avoids counter-trend trading, improving the success rate of trend-following trades.
|
||
|
|
|
||
|
|
4. **Visual Intuitiveness**: The strategy provides clear visual aids, including Bollinger Bands, order block lines, swing high/low lines, and momentum candle color markings, allowing traders to intuitively understand market conditions.
|
||
|
|
|
||
|
|
5. **Flexibility**: Strategy parameters are highly customizable, including Bollinger Band length, standard deviation multiplier, order block lookback length, swing lookback length, and momentum candle threshold, adaptable to different market environments.
|
||
|
|
|
||
|
|
6. **Intelligent Money Management**: Uses an equity-based position sizing method, effectively managing risk and preventing single trades from causing excessive losses.
|
||
|
|
|
||
|
|
#### Strategy Risks
|
||
|
|
|
||
|
|
1. **Over-optimization Risk**: The strategy includes multiple adjustable parameters, such as Bollinger Band length (55), standard deviation multiplier (2.0), and lookback periods, which can easily lead to parameter over-optimization and curve-fitting problems. The solution is to conduct robustness testing across different timeframes and market environments.
|
||
|
|
|
||
|
|
2. **Lag Issues**: Both Bollinger Bands and SMC elements are calculated based on historical data and have certain lag, potentially leading to less-than-ideal entry timing. The solution is to integrate price action analysis and other leading indicators to assist judgment.
|
||
|
|
|
||
|
|
3. **Trend Reversal Risk**: In strong market reversals, the strategy may experience consecutive losses. The solution is to add trend reversal detection mechanisms or pause trading during extreme market conditions.
|
||
|
|
|
||
|
|
4. **Money Management Challenges**: A fixed 5% capital allocation may be too risky in highly volatile markets. The solution is to dynamically adjust capital allocation ratios according to market volatility.
|
||
|
|
|
||
|
|
5. **Liquidity Risk**: In markets with lower liquidity, order blocks and liquidity zones may not be accurate enough. The solution is to add volume confirmation mechanisms or only apply the strategy in markets with sufficient liquidity.
|
||
|
|
|
||
|
|
#### Strategy Optimization Directions
|
||
|
|
|
||
|
|
1. **Dynamic Parameter Adjustment**: Introduce adaptive mechanisms to automatically adjust the Bollinger Band standard deviation multiplier and length parameters based on market volatility, allowing the strategy to better adapt to different market environments. This addresses the issue of static parameters performing inconsistently under different market conditions.
|
||
|
|
|
||
|
|
2. **Enhanced Trend Identification**: Introduce additional trend indicators, such as Directional Movement Index (DMI) or Average Directional Index (ADX), to further confirm trend strength and avoid excessive trading in weak trend markets.
|
||
|
|
|
||
|
|
3. **Improved Exit Mechanisms**: The current exit mechanism is relatively simple; consider introducing more flexible exit methods such as trailing stops, moving average crossovers, or ATR multiple stops to better protect profits.
|
||
|
|
|
||
|
|
4. **Integration of Volume Analysis**: Add volume confirmation mechanisms to the strategy, requiring price breakouts to be accompanied by significant volume increases, further improving signal quality. Volume, as an important market participation indicator, can effectively verify the authenticity of price momentum.
|
||
|
|
|
||
|
|
5. **Introduction of Time Filters**: Markets display different characteristics during different trading sessions; add time filters to avoid generating signals during specific inefficient trading sessions (such as the Asian session consolidation period).
|
||
|
|
|
||
|
|
6. **Optimized Money Management**: Introduce ATR-based position sizing methods to dynamically adjust risk exposure based on market volatility, reducing exposure in high-volatility markets and appropriately increasing positions in low-volatility markets.
|
||
|
|
|
||
|
|
#### Summary
|
||
|
|
|
||
|
|
The Momentum-Driven Bollinger Breakout with Smart Money Concepts Integration Strategy is a comprehensive trading system combining technical analysis and market structure theory. This strategy captures price momentum through Bollinger Band breakouts, identifies key price levels and market structure changes using SMC theory, and enhances signal reliability through a momentum candle filter. The multi-level signal confirmation mechanism significantly reduces false signals, while the optional higher timeframe trend confirmation helps avoid counter-trend trading.
|
||
|
|
|
||
|
|
Although the strategy has clear logic and multiple advantages, traders still need to be aware of potential risks, including parameter optimization risk, lag issues, and trend reversal risk. By introducing dynamic parameter adjustments, enhanced trend identification, improved exit mechanisms, and integrated volume analysis, the strategy's robustness and adaptability can be further enhanced.
|
||
|
|
|
||
|
|
Ultimately, traders should remember that there is no perfect trading strategy. The key lies in understanding the core logic of the strategy, managing risk reasonably, and flexibly adjusting according to different market environments. Before practical application, it is recommended to conduct thorough backtesting and forward testing to verify the strategy's performance under different market conditions.[/trans]
|
||
|
|
|
||
|
|
|
||
|
|
|
||
|
|
> Source (PineScript)
|
||
|
|
|
||
|
|
``` pinescript
|
||
|
|
/*backtest
|
||
|
|
start: 2025-01-01 00:00:00
|
||
|
|
end: 2025-04-09 00:00:00
|
||
|
|
period: 1d
|
||
|
|
basePeriod: 1d
|
||
|
|
exchanges: [{"eid":"Futures_Binance","currency":"ETH_USDT"}]
|
||
|
|
*/
|
||
|
|
|
||
|
|
//@version=6
|
||
|
|
strategy('02 SMC + BB Breakout v4 + Momentum Color', overlay=true, initial_capital=100000)
|
||
|
|
|
||
|
|
// Inputs
|
||
|
|
length = input.int(55, title='Bollinger Bands Length')
|
||
|
|
mult = input.float(2.0, title='Standard Deviation Multiplier')
|
||
|
|
higher_tf = input.timeframe('1D', title='Higher Timeframe Confirmation')
|
||
|
|
confirm_trend = input.bool(true, title='Use Higher Timeframe Trend')
|
||
|
|
show_smc = input.bool(true, title='Show SMC Elements')
|
||
|
|
ob_length = input.int(20, title="Order Block Lookback", minval=5)
|
||
|
|
swing_length = input.int(12, title="Swing Lookback", minval=5)
|
||
|
|
momentum_filter = input.bool(true, title="Require Momentum Candle for Entry")
|
||
|
|
momentum_body_percent = input.float(70, title="Momentum Candle Body %", minval=1, maxval=100) / 100.0 // Percentage of the candle's range that must be the body
|
||
|
|
|
||
|
|
// Bollinger Bands Calculation
|
||
|
|
basis = ta.sma(close, length)
|
||
|
|
upper_band = basis + mult * ta.stdev(close, length)
|
||
|
|
lower_band = basis - mult * ta.stdev(close, length)
|
||
|
|
|
||
|
|
// Higher Timeframe Confirmation
|
||
|
|
higher_tf_close = request.security(syminfo.tickerid, higher_tf, close)
|
||
|
|
higher_tf_sma = ta.sma(higher_tf_close, length)
|
||
|
|
higher_tf_trend = higher_tf_close > higher_tf_sma
|
||
|
|
|
||
|
|
// Smart Money Concepts (SMC)
|
||
|
|
// Order Blocks (Simplified as recent price clusters)
|
||
|
|
order_block_high = ta.highest(high, ob_length)
|
||
|
|
order_block_low = ta.lowest(low, ob_length)
|
||
|
|
|
||
|
|
// Liquidity Zones
|
||
|
|
recent_swing_high = ta.highest(high, swing_length)
|
||
|
|
recent_swing_low = ta.lowest(low, swing_length)
|
||
|
|
|
||
|
|
// Market Structure Shift (MSS)
|
||
|
|
previous_high = ta.valuewhen(high > ta.highest(high[1], swing_length), high[1], 0)
|
||
|
|
previous_low = ta.valuewhen(low < ta.lowest(low[1], swing_length), low[1], 0)
|
||
|
|
shift_to_bullish = close > previous_high
|
||
|
|
shift_to_bearish = close < previous_low
|
||
|
|
|
||
|
|
// Momentum Candle Check (Strong Body)
|
||
|
|
candle_range = high - low
|
||
|
|
candle_body = math.abs(close - open)
|
||
|
|
body_percentage = candle_range > 0 ? candle_body / candle_range : 0 // Avoid division by zero if range is 0
|
||
|
|
|
||
|
|
long_momentum = body_percentage >= momentum_body_percent and close > open
|
||
|
|
short_momentum = body_percentage >= momentum_body_percent and close < open
|
||
|
|
|
||
|
|
// --- START: Momentum Candle Coloring ---
|
||
|
|
// Use color.lime for a neon green effect and color.red for neon red.
|
||
|
|
bullish_momentum_color = long_momentum ? color.lime : na
|
||
|
|
bearish_momentum_color = short_momentum ? color.red : na
|
||
|
|
barcolor(bullish_momentum_color, title="Bullish Momentum Candle")
|
||
|
|
barcolor(bearish_momentum_color, title="Bearish Momentum Candle")
|
||
|
|
// --- END: Momentum Candle Coloring ---
|
||
|
|
|
||
|
|
// Entry Conditions
|
||
|
|
long_condition = ta.crossover(close, upper_band) and (not confirm_trend or higher_tf_trend) and shift_to_bullish and (not momentum_filter or long_momentum)
|
||
|
|
short_condition = ta.crossunder(close, lower_band) and (not confirm_trend or not higher_tf_trend) and shift_to_bearish and (not momentum_filter or short_momentum)
|
||
|
|
|
||
|
|
// Exit Conditions (TWEAKED)
|
||
|
|
exit_long = ta.crossunder(close, basis) or close < (order_block_low * 0.99)
|
||
|
|
exit_short = ta.crossover(close, basis) or close > (order_block_high * 1.01)
|
||
|
|
|
||
|
|
// Calculate 5% of equity for position size
|
||
|
|
risk_percent = 5.0 // Use float for percentage calculation
|
||
|
|
capital_per_trade = (strategy.equity * risk_percent) / 100
|
||
|
|
trade_qty = capital_per_trade / close
|
||
|
|
trade_qty := trade_qty < 0.000001 ? 0.000001 : trade_qty // Ensure minimum trade quantity if calculated qty is too small
|
||
|
|
|
||
|
|
// Strategy Execution
|
||
|
|
if long_condition
|
||
|
|
strategy.entry('Long', strategy.long, qty=trade_qty)
|
||
|
|
if short_condition
|
||
|
|
strategy.entry('Short', strategy.short, qty=trade_qty)
|
||
|
|
if exit_long
|
||
|
|
strategy.close('Long', comment="Exit Long")
|
||
|
|
if exit_short
|
||
|
|
strategy.close('Short', comment="Exit Short")
|
||
|
|
|
||
|
|
// Plotting Bollinger Bands (Improved)
|
||
|
|
p1 = plot(upper_band, color=color.rgb(76, 175, 80), title='Upper BB', linewidth=2)
|
||
|
|
p2 = plot(lower_band, color=color.rgb(244, 67, 54), title='Lower BB', linewidth=2)
|
||
|
|
plot(basis, color=color.rgb(33, 150, 243), title='Basis BB', linewidth=2)
|
||
|
|
|
||
|
|
|
||
|
|
//plot entry and exit shapes
|
||
|
|
plotshape(long_condition, title="Long Entry", location=location.belowbar, color=color.new(color.green, 0), style=shape.triangleup, size=size.small)
|
||
|
|
plotshape(short_condition, title="Short Entry", location=location.abovebar, color=color.new(color.red, 0), style=shape.triangledown, size=size.small)
|
||
|
|
```
|
||
|
|
|
||
|
|
> Detail
|
||
|
|
|
||
|
|
https://www.fmz.com/strategy/489975
|
||
|
|
|
||
|
|
> Last Modified
|
||
|
|
|
||
|
|
2025-04-10 16:12:38
|