193 lines
10 KiB
Markdown
193 lines
10 KiB
Markdown

|
|
||
|
|
> Name
|
||
|
|
|
||
|
|
动量多指标趋势跟踪策略唐奇安通道超级趋势成交量过滤建仓系统-Momentum-Multi-Indicator-Trend-Following-Strategy-Donchian-Channel-with-SuperTrend-and-Volume-Filter-Entry-System
|
||
|
|
|
||
|
|
> Author
|
||
|
|
|
||
|
|
ianzeng123
|
||
|
|
|
||
|
|
> Strategy Description
|
||
|
|
|
||
|
|
|
||
|
|
|
||
|
|
|
||
|
|
|
||
|
|
[trans]
|
||
|
|
#### 概述
|
||
|
|
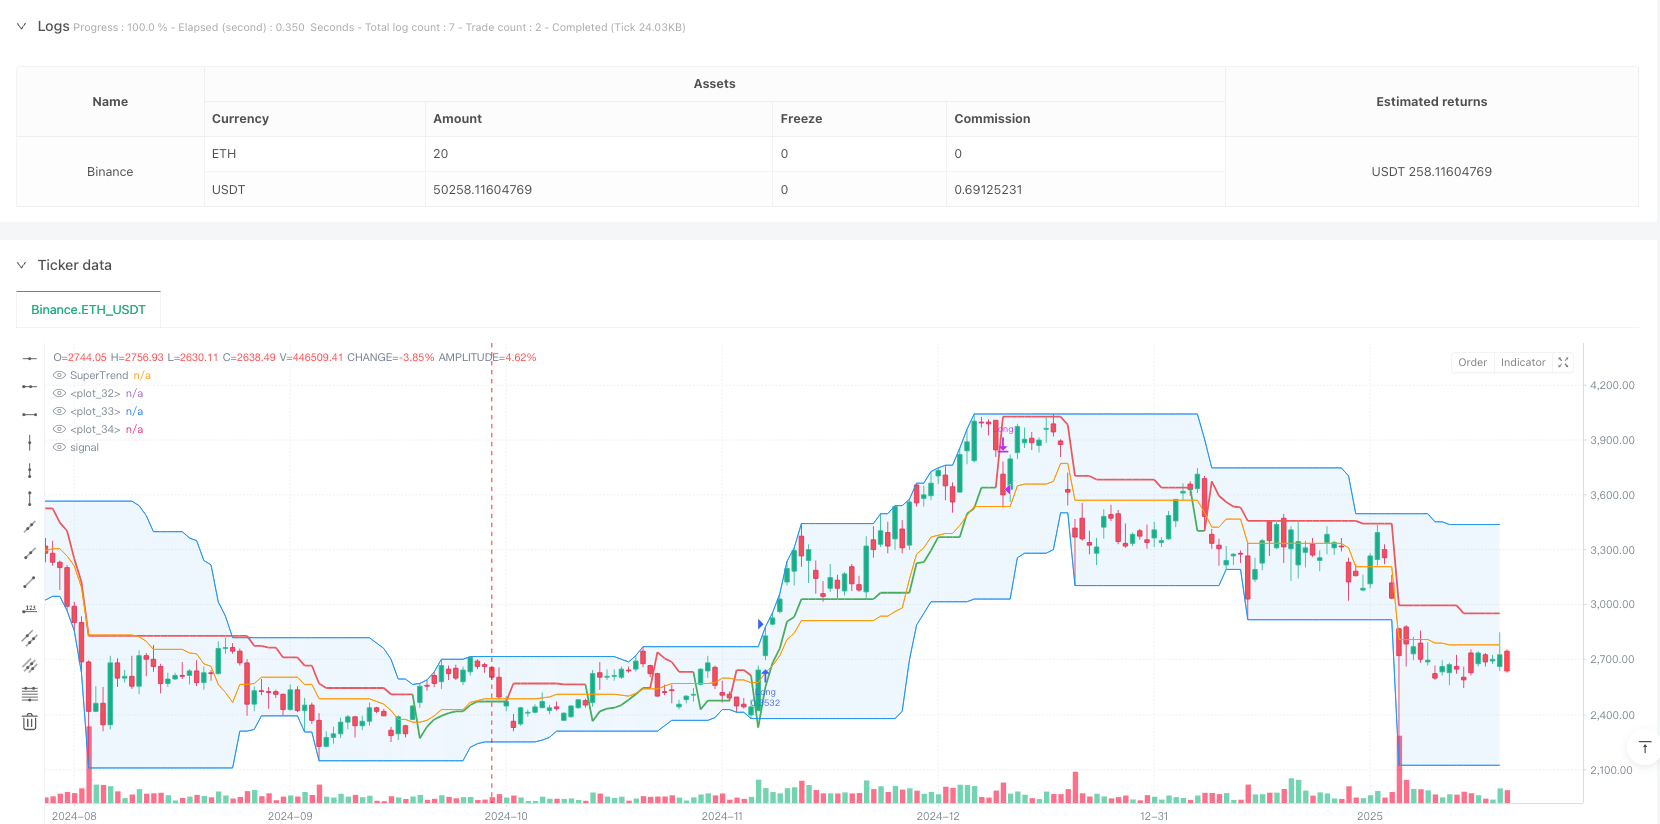
本策略是一个基于唐奇安通道(Donchian Channel)突破的趋势跟踪交易系统,结合了超级趋势指标(SuperTrend)和成交量过滤器来增强交易信号的可靠性。该策略主要通过捕捉价格突破历史高点的方式来识别潜在的多头交易机会,同时利用成交量确认和趋势跟踪指标来过滤假突破信号。策略设计灵活,可以根据不同市场环境和交易品种进行参数优化。
|
||
|
|
|
||
|
|
#### 策略原理
|
||
|
|
策略的核心逻辑基于以下几个关键组件:
|
||
|
|
1. 唐奇安通道:计算用户定义周期内的最高价和最低价,形成上轨、下轨和中轨。当价格突破上轨时,触发多头入场信号。
|
||
|
|
2. 成交量过滤器:通过比较当前成交量与20周期移动平均线,确保只在成交量放大时进场,提高突破的可靠性。
|
||
|
|
3. 超级趋势指标:作为趋势确认工具,在多头趋势时显示绿色,空头趋势时显示红色。
|
||
|
|
4. 灵活的止损机制:提供四种不同的止损选项,包括下轨止损、中轨止损、超级趋势止损和百分比跟踪止损。
|
||
|
|
|
||
|
|
#### 策略优势
|
||
|
|
1. 多重信号确认:结合价格突破、成交量确认和趋势指标,大大降低假突破风险。
|
||
|
|
2. 适应性强:通过参数调整可以适应不同的市场环境和交易周期。
|
||
|
|
3. 风险管理完善:提供多种止损选项,可以根据市场特点选择最适合的止损方式。
|
||
|
|
4. 可视化清晰:策略界面直观展示各项指标,便于交易者理解市场状态。
|
||
|
|
5. 回测灵活:允许自定义回测时间范围,便于策略优化。
|
||
|
|
|
||
|
|
#### 策略风险
|
||
|
|
1. 震荡市场风险:在区间震荡行情中可能产生频繁的假突破信号。
|
||
|
|
2. 滑点风险:在流动性较差的市场中,突破信号可能因滑点导致入场价格偏离。
|
||
|
|
3. 过度过滤风险:启用成交量过滤可能会错过一些有效的交易机会。
|
||
|
|
4. 参数敏感性:策略效果对参数设置较为敏感,需要careful优化。
|
||
|
|
|
||
|
|
#### 策略优化方向
|
||
|
|
1. 增加趋势强度过滤:可以添加ADX等趋势强度指标,只在趋势强劲时入场。
|
||
|
|
2. 优化成交量指标:可以考虑使用相对成交量或者成交量突破指标替代简单移动平均线。
|
||
|
|
3. 添加时间过滤:增加交易时间窗口设置,避开市场波动较大的时段。
|
||
|
|
4. 动态参数优化:根据市场波动率自动调整通道周期和超级趋势参数。
|
||
|
|
5. 引入机器学习:使用机器学习算法优化参数选择和信号过滤。
|
||
|
|
|
||
|
|
#### 总结
|
||
|
|
该策略通过综合运用多个技术指标,构建了一个相对完善的趋势跟踪交易系统。策略的优势在于信号可靠性高、风险管理灵活,但仍需要交易者根据具体市场特点进行参数优化。通过持续改进和优化,该策略有望在趋势市场中获得稳定的交易效果。 ||
|
||
|
|
|
||
|
|
#### Overview
|
||
|
|
This strategy is a trend-following trading system based on Donchian Channel breakouts, incorporating SuperTrend indicator and volume filter to enhance signal reliability. The strategy primarily identifies potential long trading opportunities by capturing price breakouts above historical highs, while using volume confirmation and trend-following indicators to filter false breakout signals. The strategy design is flexible and can be optimized for different market environments and trading instruments.
|
||
|
|
|
||
|
|
#### Strategy Principles
|
||
|
|
The core logic of the strategy is based on the following key components:
|
||
|
|
1. Donchian Channel: Calculates the highest and lowest prices within a user-defined period, forming upper, lower, and middle bands. Long entry signals are triggered when price breaks above the upper band.
|
||
|
|
2. Volume Filter: Compares current volume with its 20-period moving average to ensure entries only occur during volume expansion, improving breakout reliability.
|
||
|
|
3. SuperTrend Indicator: Serves as a trend confirmation tool, displaying green during bullish trends and red during bearish trends.
|
||
|
|
4. Flexible Stop-Loss Mechanism: Offers four different stop-loss options, including lower band stop, middle band stop, SuperTrend stop, and percentage trailing stop.
|
||
|
|
|
||
|
|
#### Strategy Advantages
|
||
|
|
1. Multiple Signal Confirmation: Combines price breakouts, volume confirmation, and trend indicators to significantly reduce false breakout risks.
|
||
|
|
2. High Adaptability: Can be adapted to different market environments and trading timeframes through parameter adjustment.
|
||
|
|
3. Comprehensive Risk Management: Provides multiple stop-loss options to choose the most suitable method based on market characteristics.
|
||
|
|
4. Clear Visualization: Strategy interface intuitively displays various indicators, making it easy for traders to understand market conditions.
|
||
|
|
5. Flexible Backtesting: Allows customization of backtesting date ranges for strategy optimization.
|
||
|
|
|
||
|
|
#### Strategy Risks
|
||
|
|
1. Choppy Market Risk: May generate frequent false breakout signals in range-bound markets.
|
||
|
|
2. Slippage Risk: In less liquid markets, breakout signals may result in entry prices deviating due to slippage.
|
||
|
|
3. Over-Filtering Risk: Enabling volume filter might miss some valid trading opportunities.
|
||
|
|
4. Parameter Sensitivity: Strategy performance is sensitive to parameter settings, requiring careful optimization.
|
||
|
|
|
||
|
|
#### Strategy Optimization Directions
|
||
|
|
1. Add Trend Strength Filter: Can incorporate trend strength indicators like ADX to enter only during strong trends.
|
||
|
|
2. Optimize Volume Indicator: Consider using relative volume or volume breakout indicators instead of simple moving averages.
|
||
|
|
3. Add Time Filter: Implement trading time window settings to avoid highly volatile market periods.
|
||
|
|
4. Dynamic Parameter Optimization: Automatically adjust channel period and SuperTrend parameters based on market volatility.
|
||
|
|
5. Introduce Machine Learning: Use machine learning algorithms to optimize parameter selection and signal filtering.
|
||
|
|
|
||
|
|
#### Summary
|
||
|
|
This strategy builds a relatively comprehensive trend-following trading system by integrating multiple technical indicators. Its strengths lie in high signal reliability and flexible risk management, though traders still need to optimize parameters according to specific market characteristics. Through continuous improvement and optimization, this strategy has the potential to achieve stable trading results in trending markets.[/trans]
|
||
|
|
|
||
|
|
|
||
|
|
|
||
|
|
> Source (PineScript)
|
||
|
|
|
||
|
|
``` pinescript
|
||
|
|
/*backtest
|
||
|
|
start: 2024-10-01 00:00:00
|
||
|
|
end: 2025-02-19 08:00:00
|
||
|
|
period: 1d
|
||
|
|
basePeriod: 1d
|
||
|
|
exchanges: [{"eid":"Binance","currency":"ETH_USDT"}]
|
||
|
|
*/
|
||
|
|
|
||
|
|
// Breakout trading system based on Donchain channel strategy that works best on a weekly chart and daily charts. Weekly is preferred.
|
||
|
|
|
||
|
|
//@version=5
|
||
|
|
|
||
|
|
strategy('Donchian BO with Volume Filter and Supertrend', shorttitle='DBO+Vol+ST', default_qty_type=strategy.percent_of_equity, default_qty_value=2, overlay=true)
|
||
|
|
|
||
|
|
// Input options to configure backtest date range
|
||
|
|
startDate = input.int(title='Start Date', defval=1, minval=1, maxval=31)
|
||
|
|
startMonth = input.int(title='Start Month', defval=1, minval=1, maxval=12)
|
||
|
|
startYear = input.int(title='Start Year', defval=2016, minval=1800, maxval=2100)
|
||
|
|
avgVol = input.int(title="Avg Volume length", defval=20)
|
||
|
|
srcInput = input.source(close, "Source")
|
||
|
|
|
||
|
|
// Volume filter toggle
|
||
|
|
useVolumeFilter = input.bool(true, title='Enable Volume Filter')
|
||
|
|
|
||
|
|
endDate = input.int(title='End Date', defval=1, minval=1, maxval=31)
|
||
|
|
endMonth = input.int(title='End Month', defval=7, minval=1, maxval=12)
|
||
|
|
endYear = input.int(title='End Year', defval=2030, minval=1800, maxval=2100)
|
||
|
|
|
||
|
|
multiplier = input.int(title='SuperTrend Mult', defval=2, minval=1, maxval=12)
|
||
|
|
stlen = input.int(title='SuperTrend Length', defval=10, minval=1, maxval=12)
|
||
|
|
|
||
|
|
length = input.int(21, minval=1)
|
||
|
|
exit = input.int(3, minval=1, maxval=4, title='Exit Option') // Use Option 1 to exit using lower band; Use Option 2 to exit using basis line
|
||
|
|
|
||
|
|
lower = ta.lowest(length)
|
||
|
|
upper = ta.highest(length)
|
||
|
|
basis = math.avg(upper, lower)
|
||
|
|
|
||
|
|
// Plotting the Donchian channel
|
||
|
|
l = plot(lower, color=color.new(color.blue, 0))
|
||
|
|
u = plot(upper, color=color.new(color.blue, 0))
|
||
|
|
plot(basis, color=color.new(color.orange, 0))
|
||
|
|
fill(u, l, color=color.new(color.blue, 90))
|
||
|
|
|
||
|
|
// Check if the current bar is in the date range
|
||
|
|
inDateRange = time >= timestamp(syminfo.timezone, startYear, startMonth, startDate, 0, 0) and time < timestamp(syminfo.timezone, endYear, endMonth, endDate, 0, 0)
|
||
|
|
|
||
|
|
// Long trailing stop-loss percentage
|
||
|
|
longTrailPerc = input.float(title='Trail Long Loss (%)', minval=0.0, step=0.1, defval=3) * 0.01
|
||
|
|
longStopPrice = 0.0
|
||
|
|
|
||
|
|
longStopPrice := if strategy.position_size > 0
|
||
|
|
stopValue = close * (1 - longTrailPerc)
|
||
|
|
math.max(stopValue, longStopPrice[1])
|
||
|
|
else
|
||
|
|
0
|
||
|
|
|
||
|
|
// Volume filter: 20-period moving average
|
||
|
|
volumeMA = ta.sma(volume, avgVol)
|
||
|
|
|
||
|
|
// Long entry condition: Donchian breakout + volume filter
|
||
|
|
longCondition = ta.crossover(srcInput, upper[1]) and (not useVolumeFilter or volume > volumeMA)
|
||
|
|
longsma = ta.sma(close, 200)
|
||
|
|
|
||
|
|
if inDateRange and longCondition
|
||
|
|
strategy.entry('Long', strategy.long)
|
||
|
|
|
||
|
|
// Exit conditions
|
||
|
|
if inDateRange and exit == 1
|
||
|
|
if ta.crossunder(close, lower[1])
|
||
|
|
strategy.close('Long')
|
||
|
|
|
||
|
|
if inDateRange and exit == 2
|
||
|
|
if ta.crossunder(close, basis[1])
|
||
|
|
strategy.close('Long')
|
||
|
|
|
||
|
|
[superTrend, dir] = ta.supertrend(multiplier, stlen)
|
||
|
|
if inDateRange and exit == 3
|
||
|
|
if ta.crossunder(close, superTrend)
|
||
|
|
strategy.close('Long')
|
||
|
|
|
||
|
|
if inDateRange and exit == 4
|
||
|
|
if strategy.position_size > 0
|
||
|
|
strategy.exit(id='XL TRL STP', stop=longStopPrice)
|
||
|
|
|
||
|
|
// Short conditions (commented out for now)
|
||
|
|
shortCondition = ta.crossunder(close, lower[1])
|
||
|
|
|
||
|
|
// Exit all positions when date range ends
|
||
|
|
if not inDateRange
|
||
|
|
strategy.close_all()
|
||
|
|
|
||
|
|
// --- Add Supertrend Indicator ---
|
||
|
|
stColor = dir == 1 ? color.red : color.green
|
||
|
|
plot(superTrend, color=stColor, title="SuperTrend", linewidth=2)
|
||
|
|
|
||
|
|
```
|
||
|
|
|
||
|
|
> Detail
|
||
|
|
|
||
|
|
https://www.fmz.com/strategy/483076
|
||
|
|
|
||
|
|
> Last Modified
|
||
|
|
|
||
|
|
2025-02-21 11:47:17
|