175 lines
9.0 KiB
Markdown
175 lines
9.0 KiB
Markdown

|
|
||
|
|
> Name
|
||
|
|
|
||
|
|
动态趋势通道与相对强弱指标相结合的量化交易策略-Dynamic-Trend-Channel-and-Relative-Strength-Momentum-Trading-Strategy
|
||
|
|
|
||
|
|
> Author
|
||
|
|
|
||
|
|
ChaoZhang
|
||
|
|
|
||
|
|
> Strategy Description
|
||
|
|
|
||
|
|
|
||
|
|
|
||
|
|
[trans]
|
||
|
|
#### 概述
|
||
|
|
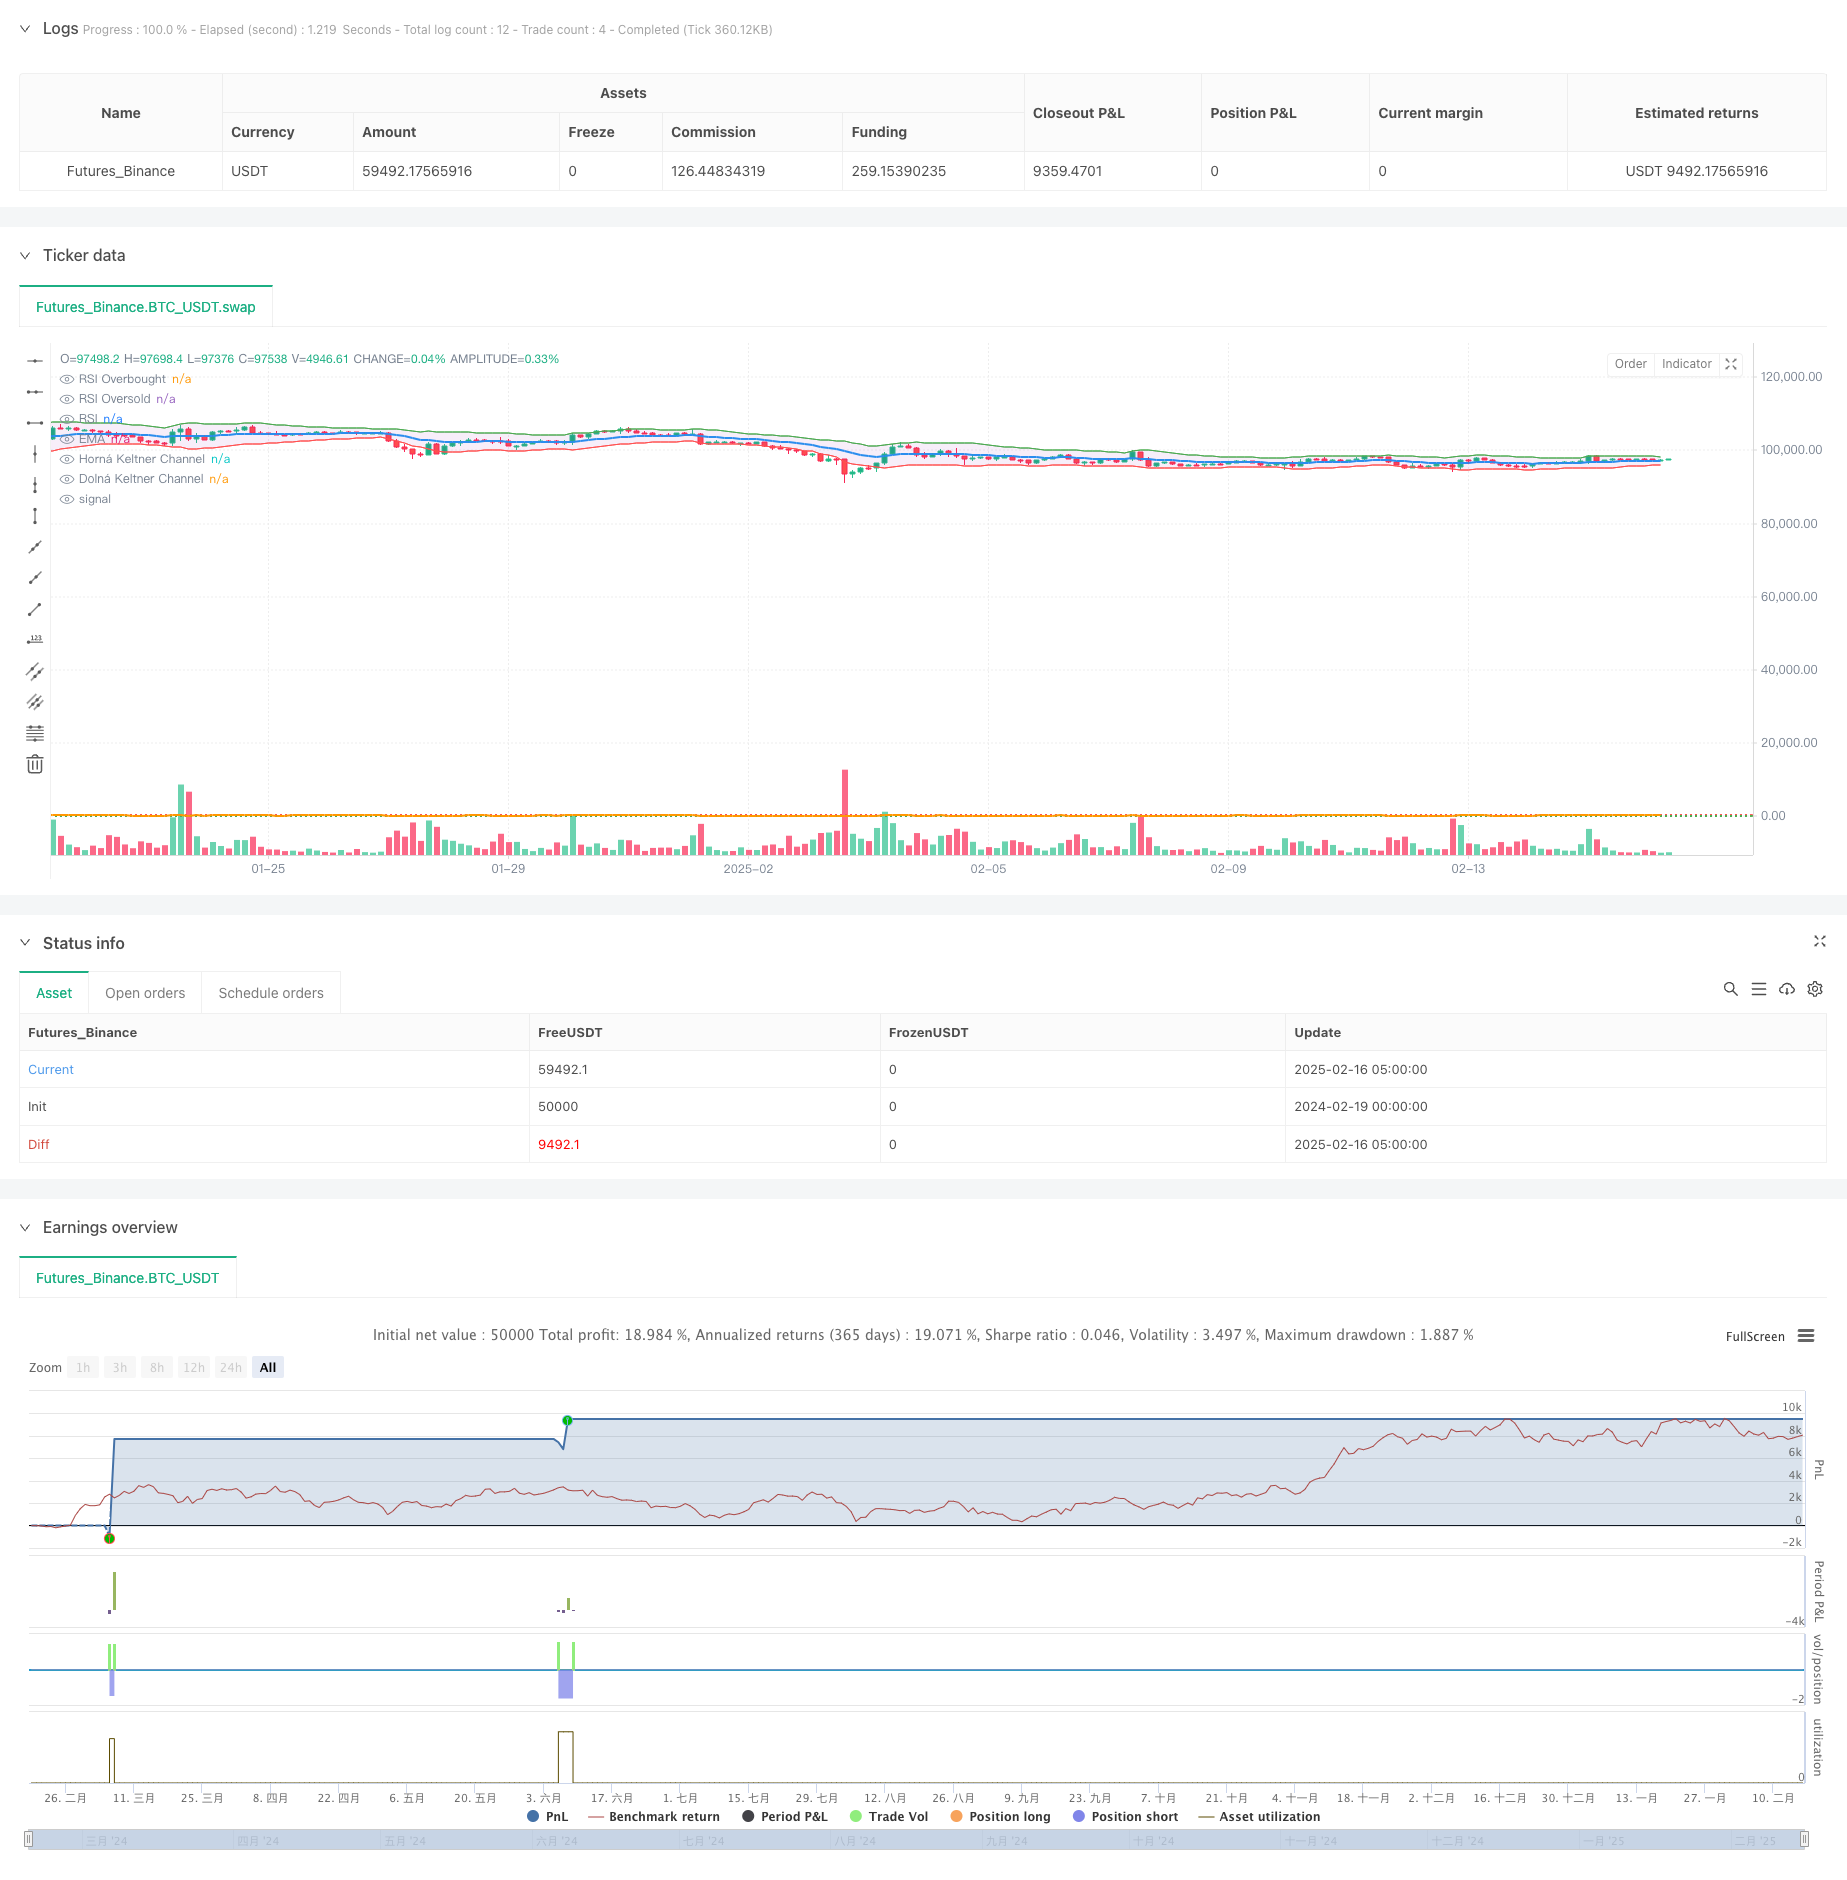
本策略是一个结合了肯特纳通道(Keltner Channel)和相对强弱指标(RSI)的量化交易系统。该策略通过动态价格通道和动量指标的配合,在市场波动中捕捉交易机会。策略采用指数移动平均线(EMA)和平均真实波幅(ATR)计算价格通道,并结合RSI指标进行交易信号的确认,实现了趋势跟踪和超买超卖的双重过滤。
|
||
|
|
|
||
|
|
#### 策略原理
|
||
|
|
策略的核心逻辑基于以下几个关键组件:
|
||
|
|
1. 肯特纳通道的构建:使用20周期的EMA作为中轨,10周期的ATR乘以1.5倍数确定上下轨,形成动态的价格波动区间。
|
||
|
|
2. RSI指标的应用:采用14周期的RSI计算,设定70和30作为超买超卖的临界值。
|
||
|
|
3. 交易信号的生成:
|
||
|
|
- 做多条件:价格突破通道下轨且RSI低于30
|
||
|
|
- 做空条件:价格突破通道上轨且RSI高于70
|
||
|
|
4. 平仓逻辑:
|
||
|
|
- 多头平仓:价格跌破EMA或RSI上升超过50
|
||
|
|
- 空头平仓:价格突破EMA或RSI下降低于50
|
||
|
|
|
||
|
|
#### 策略优势
|
||
|
|
1. 多维度确认:通过价格突破和动量指标的配合,提高了交易信号的可靠性。
|
||
|
|
2. 动态适应:肯特纳通道能够根据市场波动性自动调整区间宽度,适应不同市场环境。
|
||
|
|
3. 风险控制:使用EMA和RSI的中性水平作为平仓条件,有助于及时止盈止损。
|
||
|
|
4. 可视化支持:策略提供了清晰的图形界面,包括通道、RSI水平和交易信号标记。
|
||
|
|
|
||
|
|
#### 策略风险
|
||
|
|
1. 假突破风险:在震荡市场中可能出现频繁的假突破信号。
|
||
|
|
2. 滞后性问题:EMA和RSI都具有一定的滞后性,可能导致入场或出场时机的延迟。
|
||
|
|
3. 参数敏感性:策略效果对参数设置较为敏感,不同市场环境可能需要调整参数。
|
||
|
|
4. 趋势依赖:在无明显趋势的市场中,策略表现可能不佳。
|
||
|
|
|
||
|
|
#### 策略优化方向
|
||
|
|
1. 参数自适应:可以引入自适应机制,根据市场波动性动态调整通道参数和RSI阈值。
|
||
|
|
2. 信号过滤:增加成交量、波动率等辅助指标,提高信号质量。
|
||
|
|
3. 仓位管理:引入动态仓位管理机制,根据信号强度和市场风险调整持仓量。
|
||
|
|
4. 市场环境识别:添加市场环境判断模块,在不同市场状态下使用不同的参数组合。
|
||
|
|
|
||
|
|
#### 总结
|
||
|
|
该策略通过结合价格通道和动量指标,构建了一个较为完整的交易系统。策略的优势在于信号的多维确认和动态适应能力,但也需要注意假突破和参数敏感性等风险。通过进一步优化参数自适应性和信号过滤机制,策略的稳定性和可靠性有望得到提升。该策略适合在趋势明显的市场中应用,对于期望通过技术指标捕捉市场动量的交易者来说是一个较好的选择。
|
||
|
|
|
||
|
|
||
|
||
|
|
|
||
|
|
#### Overview
|
||
|
|
This strategy is a quantitative trading system that combines the Keltner Channel and Relative Strength Index (RSI). It captures trading opportunities in market volatility through the combination of dynamic price channels and momentum indicators. The strategy uses Exponential Moving Average (EMA) and Average True Range (ATR) to calculate price channels, coupled with RSI for trade signal confirmation, achieving dual filtration of trend following and overbought/oversold conditions.
|
||
|
|
|
||
|
|
#### Strategy Principle
|
||
|
|
The core logic of the strategy is based on the following key components:
|
||
|
|
1. Keltner Channel Construction: Uses 20-period EMA as the middle band, 10-period ATR multiplied by 1.5 for upper and lower bands, forming a dynamic price fluctuation range.
|
||
|
|
2. RSI Application: Uses 14-period RSI calculation, with 70 and 30 as overbought and oversold thresholds.
|
||
|
|
3. Trade Signal Generation:
|
||
|
|
- Long Entry: Price breaks above lower channel band and RSI is below 30
|
||
|
|
- Short Entry: Price breaks below upper channel band and RSI is above 70
|
||
|
|
4. Exit Logic:
|
||
|
|
- Long Exit: Price falls below EMA or RSI rises above 50
|
||
|
|
- Short Exit: Price rises above EMA or RSI falls below 50
|
||
|
|
|
||
|
|
#### Strategy Advantages
|
||
|
|
1. Multi-dimensional Confirmation: Improves signal reliability through the combination of price breakouts and momentum indicators.
|
||
|
|
2. Dynamic Adaptation: Keltner Channel automatically adjusts range width based on market volatility, adapting to different market environments.
|
||
|
|
3. Risk Control: Uses EMA and RSI neutral levels for exit conditions, helping with timely profit-taking and stop-loss.
|
||
|
|
4. Visual Support: Strategy provides clear graphical interface including channels, RSI levels, and trade signal markers.
|
||
|
|
|
||
|
|
#### Strategy Risks
|
||
|
|
1. False Breakout Risk: Frequent false breakout signals may occur in ranging markets.
|
||
|
|
2. Lag Issues: Both EMA and RSI have inherent lag, potentially causing delayed entry or exit timing.
|
||
|
|
3. Parameter Sensitivity: Strategy effectiveness is sensitive to parameter settings, different market environments may require parameter adjustments.
|
||
|
|
4. Trend Dependency: Strategy may underperform in markets without clear trends.
|
||
|
|
|
||
|
|
#### Strategy Optimization Directions
|
||
|
|
1. Parameter Adaptation: Introduce adaptive mechanisms to dynamically adjust channel parameters and RSI thresholds based on market volatility.
|
||
|
|
2. Signal Filtering: Add auxiliary indicators like volume and volatility to improve signal quality.
|
||
|
|
3. Position Management: Introduce dynamic position management mechanisms to adjust holdings based on signal strength and market risk.
|
||
|
|
4. Market Environment Recognition: Add market environment assessment module to use different parameter combinations in different market states.
|
||
|
|
|
||
|
|
#### Summary
|
||
|
|
This strategy builds a relatively complete trading system by combining price channels and momentum indicators. Its strengths lie in multi-dimensional signal confirmation and dynamic adaptation capability, but attention must be paid to risks such as false breakouts and parameter sensitivity. Through further optimization of parameter adaptability and signal filtering mechanisms, the strategy's stability and reliability can be improved. The strategy is suitable for application in markets with clear trends and is a good choice for traders looking to capture market momentum through technical indicators.
|
||
|
|
[/trans]
|
||
|
|
|
||
|
|
|
||
|
|
|
||
|
|
> Source (PineScript)
|
||
|
|
|
||
|
|
``` pinescript
|
||
|
|
/*backtest
|
||
|
|
start: 2024-02-19 00:00:00
|
||
|
|
end: 2025-02-16 08:00:00
|
||
|
|
period: 3h
|
||
|
|
basePeriod: 3h
|
||
|
|
exchanges: [{"eid":"Futures_Binance","currency":"BTC_USDT"}]
|
||
|
|
*/
|
||
|
|
|
||
|
|
//@version=6
|
||
|
|
strategy("Keltner Channel + RSI Stratégiia", overlay=true, default_qty_type=strategy.percent_of_equity, default_qty_value=200)
|
||
|
|
|
||
|
|
// Parametre Keltner Channel
|
||
|
|
ema_length = input.int(20, title="EMA Perióda")
|
||
|
|
atr_length = input.int(10, title="ATR Perióda")
|
||
|
|
multiplier = input.float(1.5, title="ATR Multiplikátor")
|
||
|
|
|
||
|
|
// Výpočet Keltner Channel
|
||
|
|
ema = ta.ema(close, ema_length)
|
||
|
|
atr = ta.atr(atr_length)
|
||
|
|
upper_kc = ema + (multiplier * atr)
|
||
|
|
lower_kc = ema - (multiplier * atr)
|
||
|
|
|
||
|
|
// Parametre RSI
|
||
|
|
rsi_length = input.int(14, title="RSI Perióda")
|
||
|
|
rsi_overbought = input.int(70, title="RSI Prekúpenosť")
|
||
|
|
rsi_oversold = input.int(30, title="RSI Prepredanosť")
|
||
|
|
|
||
|
|
// Výpočet RSI
|
||
|
|
rsi = ta.rsi(close, rsi_length)
|
||
|
|
|
||
|
|
// Obchodné podmienky
|
||
|
|
|
||
|
|
// Nákupná podmienka: Cena prechádza nad dolnou Keltner Channel a RSI je pod prepredanosťou
|
||
|
|
long_condition = ta.crossover(close, lower_kc) and (rsi < rsi_oversold)
|
||
|
|
|
||
|
|
// Predajná podmienka: Cena prechádza pod hornou Keltner Channel a RSI je nad prekúpenosťou
|
||
|
|
short_condition = ta.crossunder(close, upper_kc) and (rsi > rsi_overbought)
|
||
|
|
|
||
|
|
// Uzatváranie pozícií
|
||
|
|
close_long_condition = ta.crossunder(close, ema) or (rsi > 50)
|
||
|
|
close_short_condition = ta.crossover(close, ema) or (rsi < 50)
|
||
|
|
|
||
|
|
// Vstupy do pozícií
|
||
|
|
if (long_condition)
|
||
|
|
strategy.entry("Long", strategy.long)
|
||
|
|
|
||
|
|
if (short_condition)
|
||
|
|
strategy.entry("Short", strategy.short)
|
||
|
|
|
||
|
|
// Uzatváranie pozícií
|
||
|
|
if (close_long_condition)
|
||
|
|
strategy.close("Long")
|
||
|
|
|
||
|
|
if (close_short_condition)
|
||
|
|
strategy.close("Short")
|
||
|
|
|
||
|
|
// Vizualizácia indikátorov
|
||
|
|
|
||
|
|
// Keltner Channel
|
||
|
|
plot_ema = plot(ema, title="EMA", color=color.blue, linewidth=2)
|
||
|
|
plot_upper = plot(upper_kc, title="Horná Keltner Channel", color=color.green, linewidth=1)
|
||
|
|
plot_lower = plot(lower_kc, title="Dolná Keltner Channel", color=color.red, linewidth=1)
|
||
|
|
fill(plot_upper, plot_lower, color=color.new(color.purple, 90), title="Keltner Channel Fill") // Nastavenie transparentnosti priamo v farbe
|
||
|
|
|
||
|
|
// RSI
|
||
|
|
hline_overbought = hline(rsi_overbought, "RSI Overbought", color=color.red, linestyle=hline.style_dotted)
|
||
|
|
hline_oversold = hline(rsi_oversold, "RSI Oversold", color=color.green, linestyle=hline.style_dotted)
|
||
|
|
plot_rsi = plot(rsi, title="RSI", color=color.orange, linewidth=2, offset=0)
|
||
|
|
|
||
|
|
// Šípky pre signály
|
||
|
|
plotshape(series=long_condition, location=location.belowbar, color=color.green, style=shape.labelup, title="Nákupný Signál", text="BUY")
|
||
|
|
plotshape(series=short_condition, location=location.abovebar, color=color.red, style=shape.labeldown, title="Predajný Signál", text="SELL")
|
||
|
|
|
||
|
|
```
|
||
|
|
|
||
|
|
> Detail
|
||
|
|
|
||
|
|
https://www.fmz.com/strategy/482459
|
||
|
|
|
||
|
|
> Last Modified
|
||
|
|
|
||
|
|
2025-02-18 15:15:48
|