382 lines
30 KiB
Markdown
382 lines
30 KiB
Markdown

|
|
||
|
|
> Name
|
||
|
|
|
||
|
|
动态突破大师通道策略基于支撑阻力突破的自适应交易系统-Dynamic-Breakout-Master-Channel-Strategy-An-Adaptive-Trading-System-Based-on-Support-and-Resistance-Breakouts
|
||
|
|
|
||
|
|
> Author
|
||
|
|
|
||
|
|
ianzeng123
|
||
|
|
|
||
|
|
> Strategy Description
|
||
|
|
|
||
|
|
|
||
|
|
|
||
|
|
|
||
|
|
|
||
|
|
|
||
|
|
|
||
|
|
[trans]## 概述
|
||
|
|
|
||
|
|
动态突破大师通道策略是一种基于支撑阻力突破的自适应交易系统,通过动态识别市场中的关键支撑位和阻力位来捕捉价格突破带来的潜在盈利机会。该策略核心在于构建一个能够根据市场条件自动调整的动态通道,实时跟踪价格运动并在关键区间突破时发出交易信号。策略使用转折点(pivot points)算法来识别支撑和阻力区域,并根据这些区域的强度和影响力生成交易决策。
|
||
|
|
|
||
|
|
该策略提供了丰富的自定义参数,包括转折点周期、数据源选择、通道宽度限制、最小转折点强度要求以及支撑/阻力区域的显示数量等,使交易者可以根据不同市场环境和个人偏好进行灵活调整。此外,策略还支持移动平均线的整合,为交易决策提供额外的技术分析视角。
|
||
|
|
|
||
|
|
在交易逻辑上,当价格向上突破阻力区域时,系统触发买入信号;当价格向下突破支撑区域时,系统触发卖出信号。为了更贴近真实交易环境,策略还纳入了0.1%的佣金成本计算。
|
||
|
|
|
||
|
|
## 策略原理
|
||
|
|
|
||
|
|
动态突破大师通道策略的核心原理基于市场结构中支撑位和阻力位的识别与突破。其技术实现主要包括以下几个关键步骤:
|
||
|
|
|
||
|
|
1. **转折点识别**:策略使用Pine Script的`pivothigh`和`pivotlow`函数来检测价格图表中的高点和低点,这些点被视为潜在的支撑位和阻力位。用户可以选择使用"High/Low"或"Close/Open"数据源来确定这些转折点。
|
||
|
|
|
||
|
|
2. **动态通道计算**:系统根据识别出的转折点构建动态支撑阻力通道。通过`my_channel`函数,策略计算每个转折点周围的区域,并根据其强度确定通道的上限(ceiling)和下限(floor)。通道宽度受到`mymaxwidth`参数的限制,该参数基于最近300根蜡烛图的价格范围计算。
|
||
|
|
|
||
|
|
3. **区域强度评估**:策略不仅考虑转折点本身,还评估每个支撑/阻力区域的强度。强度评分基于两个因素:该区域内转折点的数量(初始强度为每个转折点20分)以及价格在该区域内活动的频率(每次触及加1分)。
|
||
|
|
|
||
|
|
4. **区域筛选与排序**:系统筛选出强度超过用户设定阈值(`mystrength * 20`)的区域,并按强度从高到低排序。最多显示用户指定数量(`mymaxzones`)的支撑阻力区域。
|
||
|
|
|
||
|
|
5. **突破检测**:策略通过比较当前收盘价与前一根蜡烛的位置相对于支撑/阻力区域的变化来检测突破。当价格从区域内部移动到区域外部,并且穿过区域的上边界(阻力突破)或下边界(支撑突破)时,系统识别为有效突破。
|
||
|
|
|
||
|
|
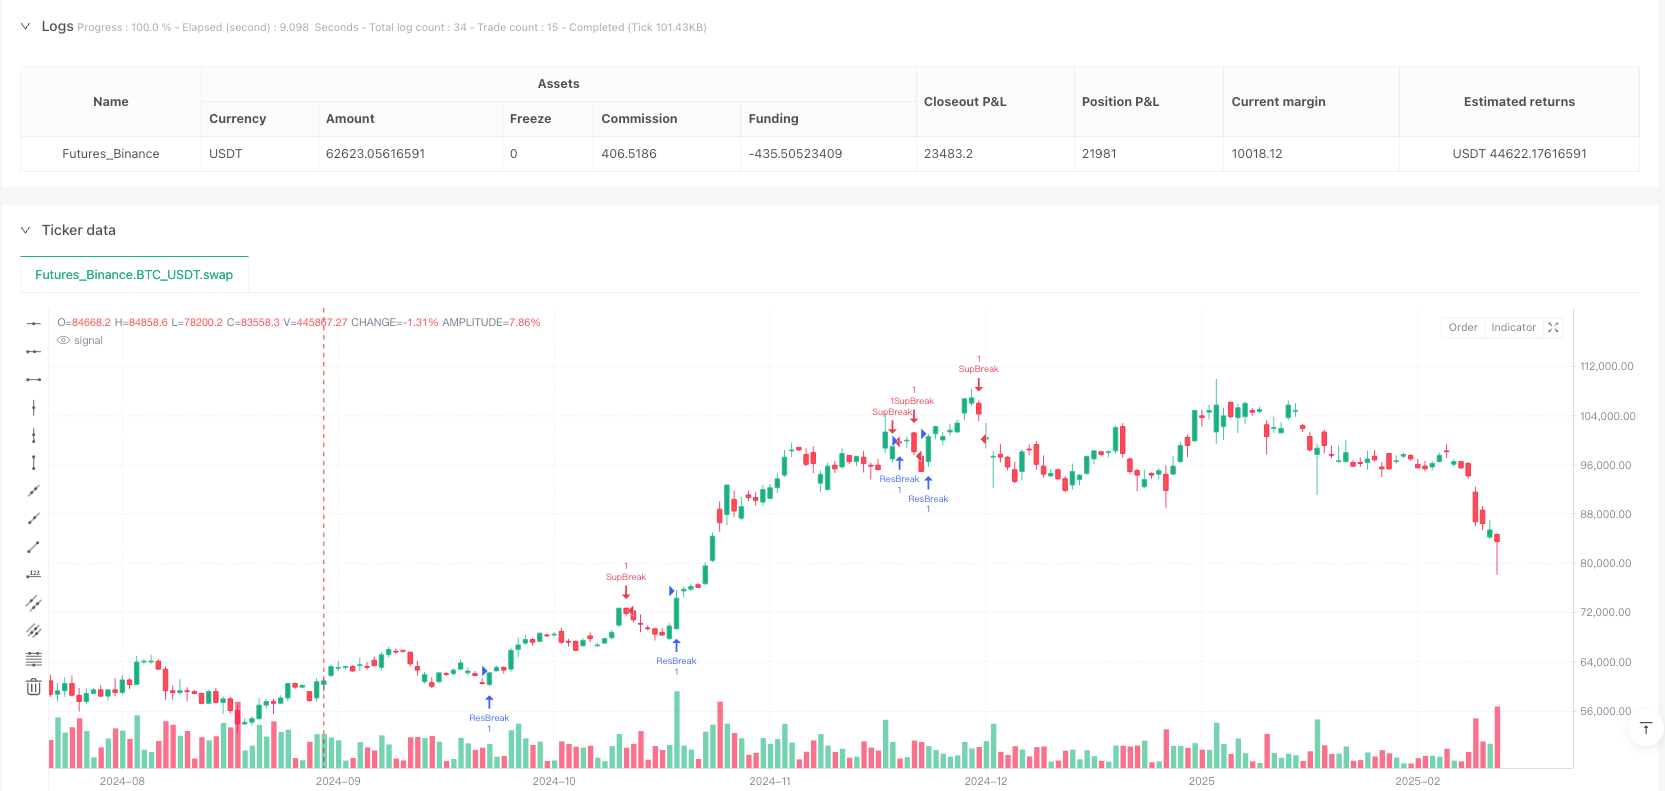
6. **交易信号生成**:在检测到阻力突破时触发做多信号("ResBreak"),检测到支撑突破时触发做空信号("SupBreak")。
|
||
|
|
|
||
|
|
## 策略优势
|
||
|
|
|
||
|
|
1. **自适应性强**:动态突破大师通道策略的最大优势在于其自适应性。通过动态识别和更新支撑阻力区域,该策略能够适应不同市场环境和价格波动模式,避免了静态支撑阻力线可能存在的滞后性问题。
|
||
|
|
|
||
|
|
2. **多维度强度评估**:策略通过考量转折点数量和价格活动频率对支撑阻力区域进行多维度强度评估,这种方法能够更精确地识别出市场中真正重要的关键区域,减少虚假突破的可能性。
|
||
|
|
|
||
|
|
3. **自定义灵活性高**:策略提供了丰富的参数设置选项,包括转折点周期、强度阈值、通道宽度等,使交易者可以根据不同交易品种、时间周期和个人风险偏好进行精细调整。
|
||
|
|
|
||
|
|
4. **视觉化效果佳**:策略在图表上直观地显示支撑阻力区域和突破点,不同颜色代表不同类型的区域(阻力、支撑或中间区域),帮助交易者更直观地理解市场结构和潜在交易机会。
|
||
|
|
|
||
|
|
5. **整合移动平均线**:策略允许添加两条不同参数的移动平均线(可选SMA或EMA),为交易决策提供额外的趋势分析视角,特别适合那些习惯结合多种技术指标进行交易的用户。
|
||
|
|
|
||
|
|
6. **交易成本考量**:策略在回测中纳入了交易佣金(0.1%)计算,使回测结果更贴近真实交易环境,有助于交易者做出更为现实的期望管理。
|
||
|
|
|
||
|
|
## 策略风险
|
||
|
|
|
||
|
|
1. **假突破风险**:尽管策略通过强度评估和筛选机制减少了虚假信号,但在高波动市场中仍可能出现假突破情况,即价格短暂突破支撑/阻力区域后又回落至原区域内。这可能导致不必要的交易损失。
|
||
|
|
|
||
|
|
**解决方法**:可以通过增加确认机制,例如要求价格在突破后保持一定时间或幅度才触发交易信号,或结合成交量指标进行突破确认。
|
||
|
|
|
||
|
|
2. **参数敏感性**:策略性能对参数设置(如转折点周期、最小强度等)较为敏感,不当的参数选择可能导致过度或不足的交易信号。
|
||
|
|
|
||
|
|
**解决方法**:建议在实盘交易前进行充分的参数优化和回测,针对特定的交易品种和时间周期找出最优参数组合。
|
||
|
|
|
||
|
|
3. **市场环境适应性**:该策略在区间震荡市场中表现较好,但在强势趋势市场或极端低波动市场中可能效果欠佳。
|
||
|
|
|
||
|
|
**解决方法**:可以添加市场环境识别机制,在不同市场条件下自动调整策略参数或暂停交易。
|
||
|
|
|
||
|
|
4. **缺乏止损机制**:当前策略仅定义了入场信号,没有明确的止损和获利策略,这可能导致在不利行情中承受过大损失。
|
||
|
|
|
||
|
|
**解决方法**:建议添加止损策略,如基于支撑阻力区域设置止损位,或使用移动止损机制保护已有利润。
|
||
|
|
|
||
|
|
5. **历史数据依赖性**:策略使用历史数据(最多400根蜡烛)来识别支撑阻力区域,在数据不足或市场结构发生根本性变化时可能表现不佳。
|
||
|
|
|
||
|
|
**解决方法**:考虑动态调整历史数据范围,或增加其他市场结构变化检测机制来提高适应性。
|
||
|
|
|
||
|
|
## 策略优化方向
|
||
|
|
|
||
|
|
1. **整合成交量分析**:目前策略仅基于价格数据进行决策,建议整合成交量分析以增强突破信号的可靠性。成交量在真实突破时通常会显著增加,这一特征可以帮助过滤掉许多假突破信号。具体实现可以通过添加成交量阈值条件,只有当突破伴随足够大的成交量时才触发交易信号。
|
||
|
|
|
||
|
|
2. **引入动态止损机制**:为策略添加智能止损系统,例如基于ATR(平均真实波幅)设置止损距离,或利用相邻的支撑阻力区域作为止损参考点。这不仅能够控制单笔交易风险,还能根据市场波动性自动调整风险敞口。
|
||
|
|
|
||
|
|
3. **增加趋势过滤器**:引入趋势识别机制,在强势趋势方向上允许突破交易,而在趋势反方向上对突破信号更加谨慎。这可以通过分析长期移动平均线斜率或使用ADX(平均方向指数)等趋势强度指标实现。
|
||
|
|
|
||
|
|
4. **添加时间过滤**:某些时间段(如市场开盘或收盘前)的突破可能更不可靠。增加时间过滤功能,避免在统计上不利的时间段进行交易,可以提高整体胜率。
|
||
|
|
|
||
|
|
5. **优化区域强度算法**:当前强度评估算法可以进一步优化,例如考虑转折点的年龄(较新的转折点可能更相关),或者引入区域反复测试次数(多次测试但未突破的区域可能强度更高)等因素。
|
||
|
|
|
||
|
|
6. **加入仓位管理逻辑**:基于区域强度、市场波动性或其他风险因素动态调整仓位大小,在高确信度情况下增加仓位,在风险较高时减少敞口。
|
||
|
|
|
||
|
|
7. **实现自适应参数**:将关键参数(如转折点周期、通道宽度等)设计为自适应的,能够根据市场波动性或其他条件自动调整,减少人为参数选择的主观性。
|
||
|
|
|
||
|
|
## 总结
|
||
|
|
|
||
|
|
动态突破大师通道策略是一个技术先进、灵活性高的交易系统,其核心优势在于能够动态识别和评估市场中的关键支撑阻力区域,并在这些区域突破时捕捉潜在的交易机会。通过精心设计的转折点识别算法和区域强度评估机制,该策略能够自适应不同市场环境,提供相对可靠的入场信号。
|
||
|
|
|
||
|
|
策略的可定制性是其另一大特点,丰富的参数选项使交易者能够根据个人偏好和交易品种特性进行精细调整。此外,策略的视觉化表现也非常直观,支撑阻力区域和突破点的清晰标记有助于交易者更好地理解市场结构和交易逻辑。
|
||
|
|
|
||
|
|
然而,该策略也存在一些局限性,如假突破风险和缺乏内置的止损机制等。为进一步提升策略性能,建议考虑整合成交量分析、增加智能止损系统、引入趋势过滤器以及优化区域强度算法等改进方向。这些优化措施将有助于提高策略的可靠性和盈利稳定性。
|
||
|
|
|
||
|
|
在实际应用中,交易者应当结合自身风险承受能力和市场经验,通过充分的回测和模拟交易来熟悉和优化策略参数,避免盲目跟随信号交易。同时,将该策略作为完整交易系统的一部分,结合其他分析工具和风险管理规则,可能会取得更为理想的交易效果。 || ## Overview
|
||
|
|
|
||
|
|
The Dynamic Breakout Master Channel Strategy is an adaptive trading system based on support and resistance breakouts, designed to capture potential profit opportunities by dynamically identifying key support and resistance levels in the market. The core of this strategy lies in constructing a dynamic channel that automatically adjusts to market conditions, tracking price movements in real-time and generating trading signals when key levels are broken. The strategy employs a pivot point algorithm to identify support and resistance zones, and generates trading decisions based on the strength and influence of these zones.
|
||
|
|
|
||
|
|
This strategy offers a rich set of customizable parameters, including pivot period, data source selection, channel width limitations, minimum pivot strength requirements, and the number of support/resistance zones to display. These options allow traders to make flexible adjustments according to different market environments and personal preferences. Additionally, the strategy supports the integration of moving averages to provide additional technical analysis perspectives for trading decisions.
|
||
|
|
|
||
|
|
In terms of trading logic, the system triggers a buy signal when the price breaks above a resistance zone, and a sell signal when the price breaks below a support zone. To better reflect real trading conditions, the strategy also incorporates a 0.1% commission cost calculation.
|
||
|
|
|
||
|
|
## Strategy Principles
|
||
|
|
|
||
|
|
The core principle of the Dynamic Breakout Master Channel Strategy is based on the identification and breakout of support and resistance levels in market structure. Its technical implementation includes the following key steps:
|
||
|
|
|
||
|
|
1. **Pivot Identification**: The strategy uses Pine Script's `pivothigh` and `pivotlow` functions to detect high and low points in the price chart, which are viewed as potential support and resistance levels. Users can choose to use either "High/Low" or "Close/Open" data sources to determine these pivot points.
|
||
|
|
|
||
|
|
2. **Dynamic Channel Calculation**: The system constructs dynamic support and resistance channels based on the identified pivot points. Through the `my_channel` function, the strategy calculates the area around each pivot point and determines the upper (ceiling) and lower (floor) limits of the channel based on its strength. The channel width is limited by the `mymaxwidth` parameter, which is calculated based on the price range of the most recent 300 candles.
|
||
|
|
|
||
|
|
3. **Zone Strength Assessment**: The strategy not only considers the pivot points themselves but also evaluates the strength of each support/resistance zone. The strength score is based on two factors: the number of pivot points within the zone (initial strength of 20 points per pivot) and the frequency of price activity within the zone (adding 1 point for each touch).
|
||
|
|
|
||
|
|
4. **Zone Filtering and Sorting**: The system filters out zones with strength exceeding the user-defined threshold (`mystrength * 20`) and sorts them by strength from highest to lowest. A maximum number of support/resistance zones specified by the user (`mymaxzones`) are displayed.
|
||
|
|
|
||
|
|
5. **Breakout Detection**: The strategy detects breakouts by comparing the current closing price with the position of the previous candle relative to the support/resistance zones. When the price moves from inside a zone to outside, crossing either the upper boundary (resistance breakout) or lower boundary (support breakout) of the zone, the system identifies it as a valid breakout.
|
||
|
|
|
||
|
|
6. **Trading Signal Generation**: A long signal ("ResBreak") is triggered when a resistance breakout is detected, and a short signal ("SupBreak") is triggered when a support breakout is detected.
|
||
|
|
|
||
|
|
## Strategy Advantages
|
||
|
|
|
||
|
|
1. **Strong Adaptability**: The greatest advantage of the Dynamic Breakout Master Channel Strategy is its adaptability. By dynamically identifying and updating support and resistance zones, this strategy can adapt to different market environments and price fluctuation patterns, avoiding the potential lag issues that may exist with static support and resistance lines.
|
||
|
|
|
||
|
|
2. **Multi-dimensional Strength Assessment**: The strategy evaluates support and resistance zones through a multi-dimensional strength assessment that considers both the number of pivot points and the frequency of price activity. This approach can more accurately identify truly important key zones in the market, reducing the possibility of false breakouts.
|
||
|
|
|
||
|
|
3. **High Customization Flexibility**: The strategy offers a rich set of parameter settings, including pivot period, strength threshold, channel width, and more, allowing traders to make fine adjustments according to different trading instruments, time frames, and personal risk preferences.
|
||
|
|
|
||
|
|
4. **Excellent Visualization**: The strategy visually displays support and resistance zones and breakout points on the chart, with different colors representing different types of zones (resistance, support, or middle zone), helping traders to understand market structure and potential trading opportunities more intuitively.
|
||
|
|
|
||
|
|
5. **Integration of Moving Averages**: The strategy allows the addition of two moving averages with different parameters (either SMA or EMA), providing additional trend analysis perspectives for trading decisions, particularly suitable for users who are accustomed to combining multiple technical indicators for trading.
|
||
|
|
|
||
|
|
6. **Trading Cost Consideration**: The strategy incorporates trading commission (0.1%) calculation in backtesting, making the backtest results closer to real trading environments and helping traders make more realistic expectations.
|
||
|
|
|
||
|
|
## Strategy Risks
|
||
|
|
|
||
|
|
1. **False Breakout Risk**: Despite the strategy's strength assessment and filtering mechanisms to reduce false signals, false breakouts may still occur in highly volatile markets, where the price briefly breaks through a support/resistance zone before falling back into the original zone. This may lead to unnecessary trading losses.
|
||
|
|
|
||
|
|
**Solution**: Add confirmation mechanisms, such as requiring the price to maintain a certain time or magnitude after breakout before triggering a trading signal, or combining volume indicators for breakout confirmation.
|
||
|
|
|
||
|
|
2. **Parameter Sensitivity**: The strategy's performance is relatively sensitive to parameter settings (such as pivot period, minimum strength, etc.), and inappropriate parameter choices may lead to excessive or insufficient trading signals.
|
||
|
|
|
||
|
|
**Solution**: It is recommended to conduct thorough parameter optimization and backtesting before live trading, to find the optimal parameter combination for specific trading instruments and time frames.
|
||
|
|
|
||
|
|
3. **Market Environment Adaptability**: This strategy performs well in range-bound markets but may be less effective in strong trend markets or extremely low volatility markets.
|
||
|
|
|
||
|
|
**Solution**: Add market environment recognition mechanisms to automatically adjust strategy parameters or pause trading under different market conditions.
|
||
|
|
|
||
|
|
4. **Lack of Stop-Loss Mechanism**: The current strategy only defines entry signals without clear stop-loss and profit-taking strategies, which may lead to excessive losses in unfavorable market conditions.
|
||
|
|
|
||
|
|
**Solution**: It is recommended to add stop-loss strategies, such as setting stop-loss levels based on support/resistance zones, or using trailing stop mechanisms to protect existing profits.
|
||
|
|
|
||
|
|
5. **Historical Data Dependency**: The strategy uses historical data (up to 400 candles) to identify support and resistance zones, and may not perform well when data is insufficient or when market structure undergoes fundamental changes.
|
||
|
|
|
||
|
|
**Solution**: Consider dynamically adjusting the historical data range, or adding other market structure change detection mechanisms to improve adaptability.
|
||
|
|
|
||
|
|
## Strategy Optimization Directions
|
||
|
|
|
||
|
|
1. **Integrate Volume Analysis**: The current strategy makes decisions based solely on price data. It is recommended to integrate volume analysis to enhance the reliability of breakout signals. Volume typically increases significantly during true breakouts, a characteristic that can help filter out many false breakout signals. This can be implemented by adding volume threshold conditions, triggering trading signals only when breakouts are accompanied by sufficient volume.
|
||
|
|
|
||
|
|
2. **Introduce Dynamic Stop-Loss Mechanism**: Add an intelligent stop-loss system to the strategy, such as setting stop-loss distances based on ATR (Average True Range), or using adjacent support/resistance zones as stop-loss reference points. This not only controls risk for individual trades but also automatically adjusts risk exposure based on market volatility.
|
||
|
|
|
||
|
|
3. **Add Trend Filter**: Introduce a trend recognition mechanism, allowing breakout trades in the direction of strong trends while being more cautious about breakout signals in the opposite direction of the trend. This can be achieved by analyzing the slope of long-term moving averages or using trend strength indicators such as ADX (Average Directional Index).
|
||
|
|
|
||
|
|
4. **Add Time Filter**: Breakouts during certain time periods (such as market opening or before closing) may be less reliable. Adding time filtering functionality, avoiding trading during statistically unfavorable time periods, can improve overall win rate.
|
||
|
|
|
||
|
|
5. **Optimize Zone Strength Algorithm**: The current strength assessment algorithm can be further optimized, for example, by considering the age of pivot points (newer pivot points may be more relevant), or introducing factors such as the number of times a zone has been tested but not broken (zones that have been tested multiple times without breaking may have higher strength).
|
||
|
|
|
||
|
|
6. **Add Position Management Logic**: Dynamically adjust position size based on zone strength, market volatility, or other risk factors, increasing position in high-confidence situations and reducing exposure in higher-risk situations.
|
||
|
|
|
||
|
|
7. **Implement Adaptive Parameters**: Design key parameters (such as pivot period, channel width, etc.) to be adaptive, automatically adjusting based on market volatility or other conditions, reducing the subjectivity of manual parameter selection.
|
||
|
|
|
||
|
|
## Summary
|
||
|
|
|
||
|
|
The Dynamic Breakout Master Channel Strategy is a technically advanced and highly flexible trading system, with its core advantage being the ability to dynamically identify and evaluate key support and resistance zones in the market, and capture potential trading opportunities when these zones break. Through carefully designed pivot point identification algorithms and zone strength assessment mechanisms, this strategy can adapt to different market environments and provide relatively reliable entry signals.
|
||
|
|
|
||
|
|
Customizability is another major feature of the strategy, with a rich set of parameter options allowing traders to make fine adjustments according to personal preferences and the characteristics of trading instruments. In addition, the strategy's visualization is very intuitive, with clear marking of support/resistance zones and breakout points helping traders to better understand market structure and trading logic.
|
||
|
|
|
||
|
|
However, the strategy also has some limitations, such as false breakout risk and lack of built-in stop-loss mechanisms. To further enhance strategy performance, it is recommended to consider integrating volume analysis, adding intelligent stop-loss systems, introducing trend filters, and optimizing zone strength algorithms. These optimization measures will help improve the reliability and profitability stability of the strategy.
|
||
|
|
|
||
|
|
In practical application, traders should combine their own risk tolerance and market experience, through thorough backtesting and simulation trading to familiarize themselves with and optimize strategy parameters, avoiding blindly following signal trading. At the same time, using this strategy as part of a complete trading system, combined with other analysis tools and risk management rules, may achieve more ideal trading results.[/trans]
|
||
|
|
|
||
|
|
|
||
|
|
|
||
|
|
> Source (PineScript)
|
||
|
|
|
||
|
|
``` pinescript
|
||
|
|
/*backtest
|
||
|
|
start: 2024-09-19 00:00:00
|
||
|
|
end: 2025-03-01 08:00:00
|
||
|
|
period: 1d
|
||
|
|
basePeriod: 1d
|
||
|
|
exchanges: [{"eid":"Futures_Binance","currency":"BTC_USDT"}]
|
||
|
|
*/
|
||
|
|
|
||
|
|
// This Pine Script™ code is subject to the terms of the Mozilla Public License 2.0 at https://mozilla.org/MPL/2.0/
|
||
|
|
// © tradingbauhaus
|
||
|
|
|
||
|
|
//@version=6
|
||
|
|
strategy("Dynamic Breakout Master by tradingbauhaus ", overlay=true, max_bars_back=501, commission_type=strategy.commission.percent, commission_value=0.1)
|
||
|
|
|
||
|
|
// My Custom Inputs
|
||
|
|
myperiod = input.int(10, "Pivot Period", minval=4, maxval=30, group="Settings", tooltip="Bars on each side for pivots")
|
||
|
|
mysource = input.string("High/Low", "Data Source", options=["High/Low", "Close/Open"], group="Settings", tooltip="Where I grab pivots from")
|
||
|
|
mychannelwidth = input.int(5, "Max Channel Width %", minval=1, maxval=8, group="Settings", tooltip="Percentage based on 300 bars")
|
||
|
|
mystrength = input.int(1, "Min Strength", minval=1, group="Settings", tooltip="Min pivots per channel")
|
||
|
|
mymaxzones = input.int(6, "Max S/R Zones", minval=1, maxval=10, group="Settings", tooltip="Max S/R zones to show") - 1
|
||
|
|
mylookback = input.int(290, "Lookback Period", minval=100, maxval=400, group="Settings", tooltip="Bars back to check pivots")
|
||
|
|
myrescolor = input.color(color.new(color.red, 75), "Resistance Tone", group="Colors")
|
||
|
|
mysupcolor = input.color(color.new(color.blue, 75), "Support Tone", group="Colors")
|
||
|
|
myincolor = input.color(color.new(color.gray, 75), "In-Channel Tone", group="Colors")
|
||
|
|
myshowpivots = input.bool(false, "Show Pivots", group="Extras")
|
||
|
|
myshowbreaks = input.bool(false, "Show Breaks", group="Extras")
|
||
|
|
myma1_on = input.bool(false, "MA1 On", group="Extras")
|
||
|
|
myma1_len = input.int(50, "MA1 Length", minval=1, group="Extras")
|
||
|
|
myma1_type = input.string("SMA", "MA1 Type", options=["SMA", "EMA"], group="Extras")
|
||
|
|
myma2_on = input.bool(false, "MA2 On", group="Extras")
|
||
|
|
myma2_len = input.int(200, "MA2 Length", minval=1, group="Extras")
|
||
|
|
myma2_type = input.string("SMA", "MA2 Type", options=["SMA", "EMA"], group="Extras")
|
||
|
|
|
||
|
|
// Define commission as a constant (for display purposes, since strategy() already uses it)
|
||
|
|
mycommission = 0.1 // Matches commission_value in strategy(); adjust here if needed
|
||
|
|
|
||
|
|
// Calculate my moving averages
|
||
|
|
myma1 = myma1_on ? myma1_type == "SMA" ? ta.sma(close, myma1_len) : ta.ema(close, myma1_len) : na
|
||
|
|
myma2 = myma2_on ? myma2_type == "SMA" ? ta.sma(close, myma2_len) : ta.ema(close, myma2_len) : na
|
||
|
|
plot(myma1, color=not na(myma1) ? color.blue : na)
|
||
|
|
plot(myma2, color=not na(myma2) ? color.red : na)
|
||
|
|
|
||
|
|
// My custom data sources
|
||
|
|
float myhigh = mysource == "High/Low" ? high : math.max(close, open)
|
||
|
|
float mylow = mysource == "High/Low" ? low : math.min(close, open)
|
||
|
|
float mypeak = ta.pivothigh(myhigh, myperiod, myperiod)
|
||
|
|
float myvalley = ta.pivotlow(mylow, myperiod, myperiod)
|
||
|
|
|
||
|
|
// Draw pivots if I want
|
||
|
|
plotshape(not na(mypeak) and myshowpivots, text="P", style=shape.labeldown, color=na, textcolor=color.new(color.red, 0), location=location.abovebar, offset=-myperiod)
|
||
|
|
plotshape(not na(myvalley) and myshowpivots, text="V", style=shape.labelup, color=na, textcolor=color.new(color.blue, 0), location=location.belowbar, offset=-myperiod)
|
||
|
|
|
||
|
|
// Calculate max channel width
|
||
|
|
mytop = ta.highest(300)
|
||
|
|
mybottom = ta.lowest(300)
|
||
|
|
mymaxwidth = (mytop - mybottom) * mychannelwidth / 100
|
||
|
|
|
||
|
|
// Store my pivots with flair
|
||
|
|
var float[] myvalues = array.new_float(0)
|
||
|
|
var float[] mypositions = array.new_float(0)
|
||
|
|
if not na(mypeak) or not na(myvalley)
|
||
|
|
array.unshift(myvalues, not na(mypeak) ? mypeak : myvalley)
|
||
|
|
array.unshift(mypositions, bar_index)
|
||
|
|
for x = array.size(myvalues) - 1 to 0
|
||
|
|
if bar_index - array.get(mypositions, x) > mylookback
|
||
|
|
array.pop(myvalues)
|
||
|
|
array.pop(mypositions)
|
||
|
|
continue
|
||
|
|
break
|
||
|
|
|
||
|
|
// My channel-making function
|
||
|
|
my_channel(ind) =>
|
||
|
|
float base = array.get(myvalues, ind)
|
||
|
|
float ceiling = base
|
||
|
|
float floor = base
|
||
|
|
int strength = 0
|
||
|
|
for y = 0 to array.size(myvalues) - 1
|
||
|
|
float level = array.get(myvalues, y)
|
||
|
|
float gap = level <= ceiling ? ceiling - level : level - floor
|
||
|
|
if gap <= mymaxwidth
|
||
|
|
if level <= ceiling
|
||
|
|
floor := math.min(floor, level)
|
||
|
|
else
|
||
|
|
ceiling := math.max(ceiling, level)
|
||
|
|
strength += 20
|
||
|
|
[ceiling, floor, strength]
|
||
|
|
|
||
|
|
// My S/R zones and swap function
|
||
|
|
var float[] sr_zones = array.new_float(20, 0)
|
||
|
|
myswap(x, y) =>
|
||
|
|
temp = array.get(sr_zones, y * 2)
|
||
|
|
array.set(sr_zones, y * 2, array.get(sr_zones, x * 2))
|
||
|
|
array.set(sr_zones, x * 2, temp)
|
||
|
|
temp := array.get(sr_zones, y * 2 + 1)
|
||
|
|
array.set(sr_zones, y * 2 + 1, array.get(sr_zones, x * 2 + 1))
|
||
|
|
array.set(sr_zones, x * 2 + 1, temp)
|
||
|
|
|
||
|
|
// Main logic with my twist
|
||
|
|
if not na(mypeak) or not na(myvalley)
|
||
|
|
float[] levels = array.new_float(0)
|
||
|
|
float[] power = array.new_float(10, 0)
|
||
|
|
for x = 0 to array.size(myvalues) - 1
|
||
|
|
[c, f, s] = my_channel(x)
|
||
|
|
array.push(levels, s)
|
||
|
|
array.push(levels, c)
|
||
|
|
array.push(levels, f)
|
||
|
|
for x = 0 to array.size(myvalues) - 1
|
||
|
|
highlvl = array.get(levels, x * 3 + 1)
|
||
|
|
lowlvl = array.get(levels, x * 3 + 2)
|
||
|
|
boost = 0
|
||
|
|
for y = 0 to mylookback
|
||
|
|
if high[y] <= highlvl and high[y] >= lowlvl or low[y] <= highlvl and low[y] >= lowlvl
|
||
|
|
boost += 1
|
||
|
|
array.set(levels, x * 3, array.get(levels, x * 3) + boost)
|
||
|
|
array.fill(sr_zones, 0)
|
||
|
|
counter = 0
|
||
|
|
for x = 0 to array.size(myvalues) - 1
|
||
|
|
maxpower = -1.
|
||
|
|
maxspot = -1
|
||
|
|
for y = 0 to array.size(myvalues) - 1
|
||
|
|
if array.get(levels, y * 3) > maxpower and array.get(levels, y * 3) >= mystrength * 20
|
||
|
|
maxpower := array.get(levels, y * 3)
|
||
|
|
maxspot := y
|
||
|
|
if maxspot >= 0
|
||
|
|
top = array.get(levels, maxspot * 3 + 1)
|
||
|
|
bottom = array.get(levels, maxspot * 3 + 2)
|
||
|
|
array.set(sr_zones, counter * 2, top)
|
||
|
|
array.set(sr_zones, counter * 2 + 1, bottom)
|
||
|
|
array.set(power, counter, array.get(levels, maxspot * 3))
|
||
|
|
for y = 0 to array.size(myvalues) - 1
|
||
|
|
if array.get(levels, y * 3 + 1) <= top and array.get(levels, y * 3 + 1) >= bottom or array.get(levels, y * 3 + 2) <= top and array.get(levels, y * 3 + 2) >= bottom
|
||
|
|
array.set(levels, y * 3, -1)
|
||
|
|
counter += 1
|
||
|
|
if counter >= 10
|
||
|
|
break
|
||
|
|
for x = 0 to 8
|
||
|
|
for y = x + 1 to 9
|
||
|
|
if array.get(power, y) > array.get(power, x)
|
||
|
|
temp = array.get(power, y)
|
||
|
|
array.set(power, y, array.get(power, x))
|
||
|
|
myswap(x, y)
|
||
|
|
|
||
|
|
// My level and color functions
|
||
|
|
mylevel(ind) =>
|
||
|
|
float result = na
|
||
|
|
if ind < array.size(sr_zones) and array.get(sr_zones, ind) != 0
|
||
|
|
result := array.get(sr_zones, ind)
|
||
|
|
result
|
||
|
|
|
||
|
|
mycolor(ind) =>
|
||
|
|
color shade = na
|
||
|
|
if ind < array.size(sr_zones) and array.get(sr_zones, ind) != 0
|
||
|
|
shade := array.get(sr_zones, ind) > close and array.get(sr_zones, ind + 1) > close ? myrescolor : array.get(sr_zones, ind) < close and array.get(sr_zones, ind + 1) < close ? mysupcolor : myincolor
|
||
|
|
shade
|
||
|
|
|
||
|
|
// Detect breaks
|
||
|
|
resistancebroken = false
|
||
|
|
supportbroken = false
|
||
|
|
outofzone = true
|
||
|
|
for x = 0 to math.min(9, mymaxzones)
|
||
|
|
if close <= array.get(sr_zones, x * 2) and close >= array.get(sr_zones, x * 2 + 1)
|
||
|
|
outofzone := false
|
||
|
|
if outofzone
|
||
|
|
for x = 0 to math.min(9, mymaxzones)
|
||
|
|
if close[1] <= array.get(sr_zones, x * 2) and close > array.get(sr_zones, x * 2)
|
||
|
|
resistancebroken := true
|
||
|
|
if close[1] >= array.get(sr_zones, x * 2 + 1) and close < array.get(sr_zones, x * 2 + 1)
|
||
|
|
supportbroken := true
|
||
|
|
|
||
|
|
// Alerts and shapes
|
||
|
|
alertcondition(resistancebroken, title="ResBreak", message="Resistance shattered!")
|
||
|
|
alertcondition(supportbroken, title="SupBreak", message="Support cracked!")
|
||
|
|
plotshape(myshowbreaks and resistancebroken, style=shape.triangleup, location=location.belowbar, color=color.new(color.blue, 0), size=size.tiny)
|
||
|
|
plotshape(myshowbreaks and supportbroken, style=shape.triangledown, location=location.abovebar, color=color.new(color.red, 0), size=size.tiny)
|
||
|
|
|
||
|
|
// Strategy with commissions factored in
|
||
|
|
if resistancebroken
|
||
|
|
strategy.entry("ResBreak", strategy.long)
|
||
|
|
if supportbroken
|
||
|
|
strategy.entry("SupBreak", strategy.short)
|
||
|
|
```
|
||
|
|
|
||
|
|
> Detail
|
||
|
|
|
||
|
|
https://www.fmz.com/strategy/484592
|
||
|
|
|
||
|
|
> Last Modified
|
||
|
|
|
||
|
|
2025-03-03 10:33:02
|