144 lines
11 KiB
Markdown
144 lines
11 KiB
Markdown

|
|
||
|
|
> Name
|
||
|
|
|
||
|
|
价量突破买入策略-Price-and-Volume-Breakout-Buy-Strategy
|
||
|
|
|
||
|
|
> Author
|
||
|
|
|
||
|
|
ChaoZhang
|
||
|
|
|
||
|
|
> Strategy Description
|
||
|
|
|
||
|
|
|
||
|
|
[trans]
|
||
|
|
#### 概述
|
||
|
|
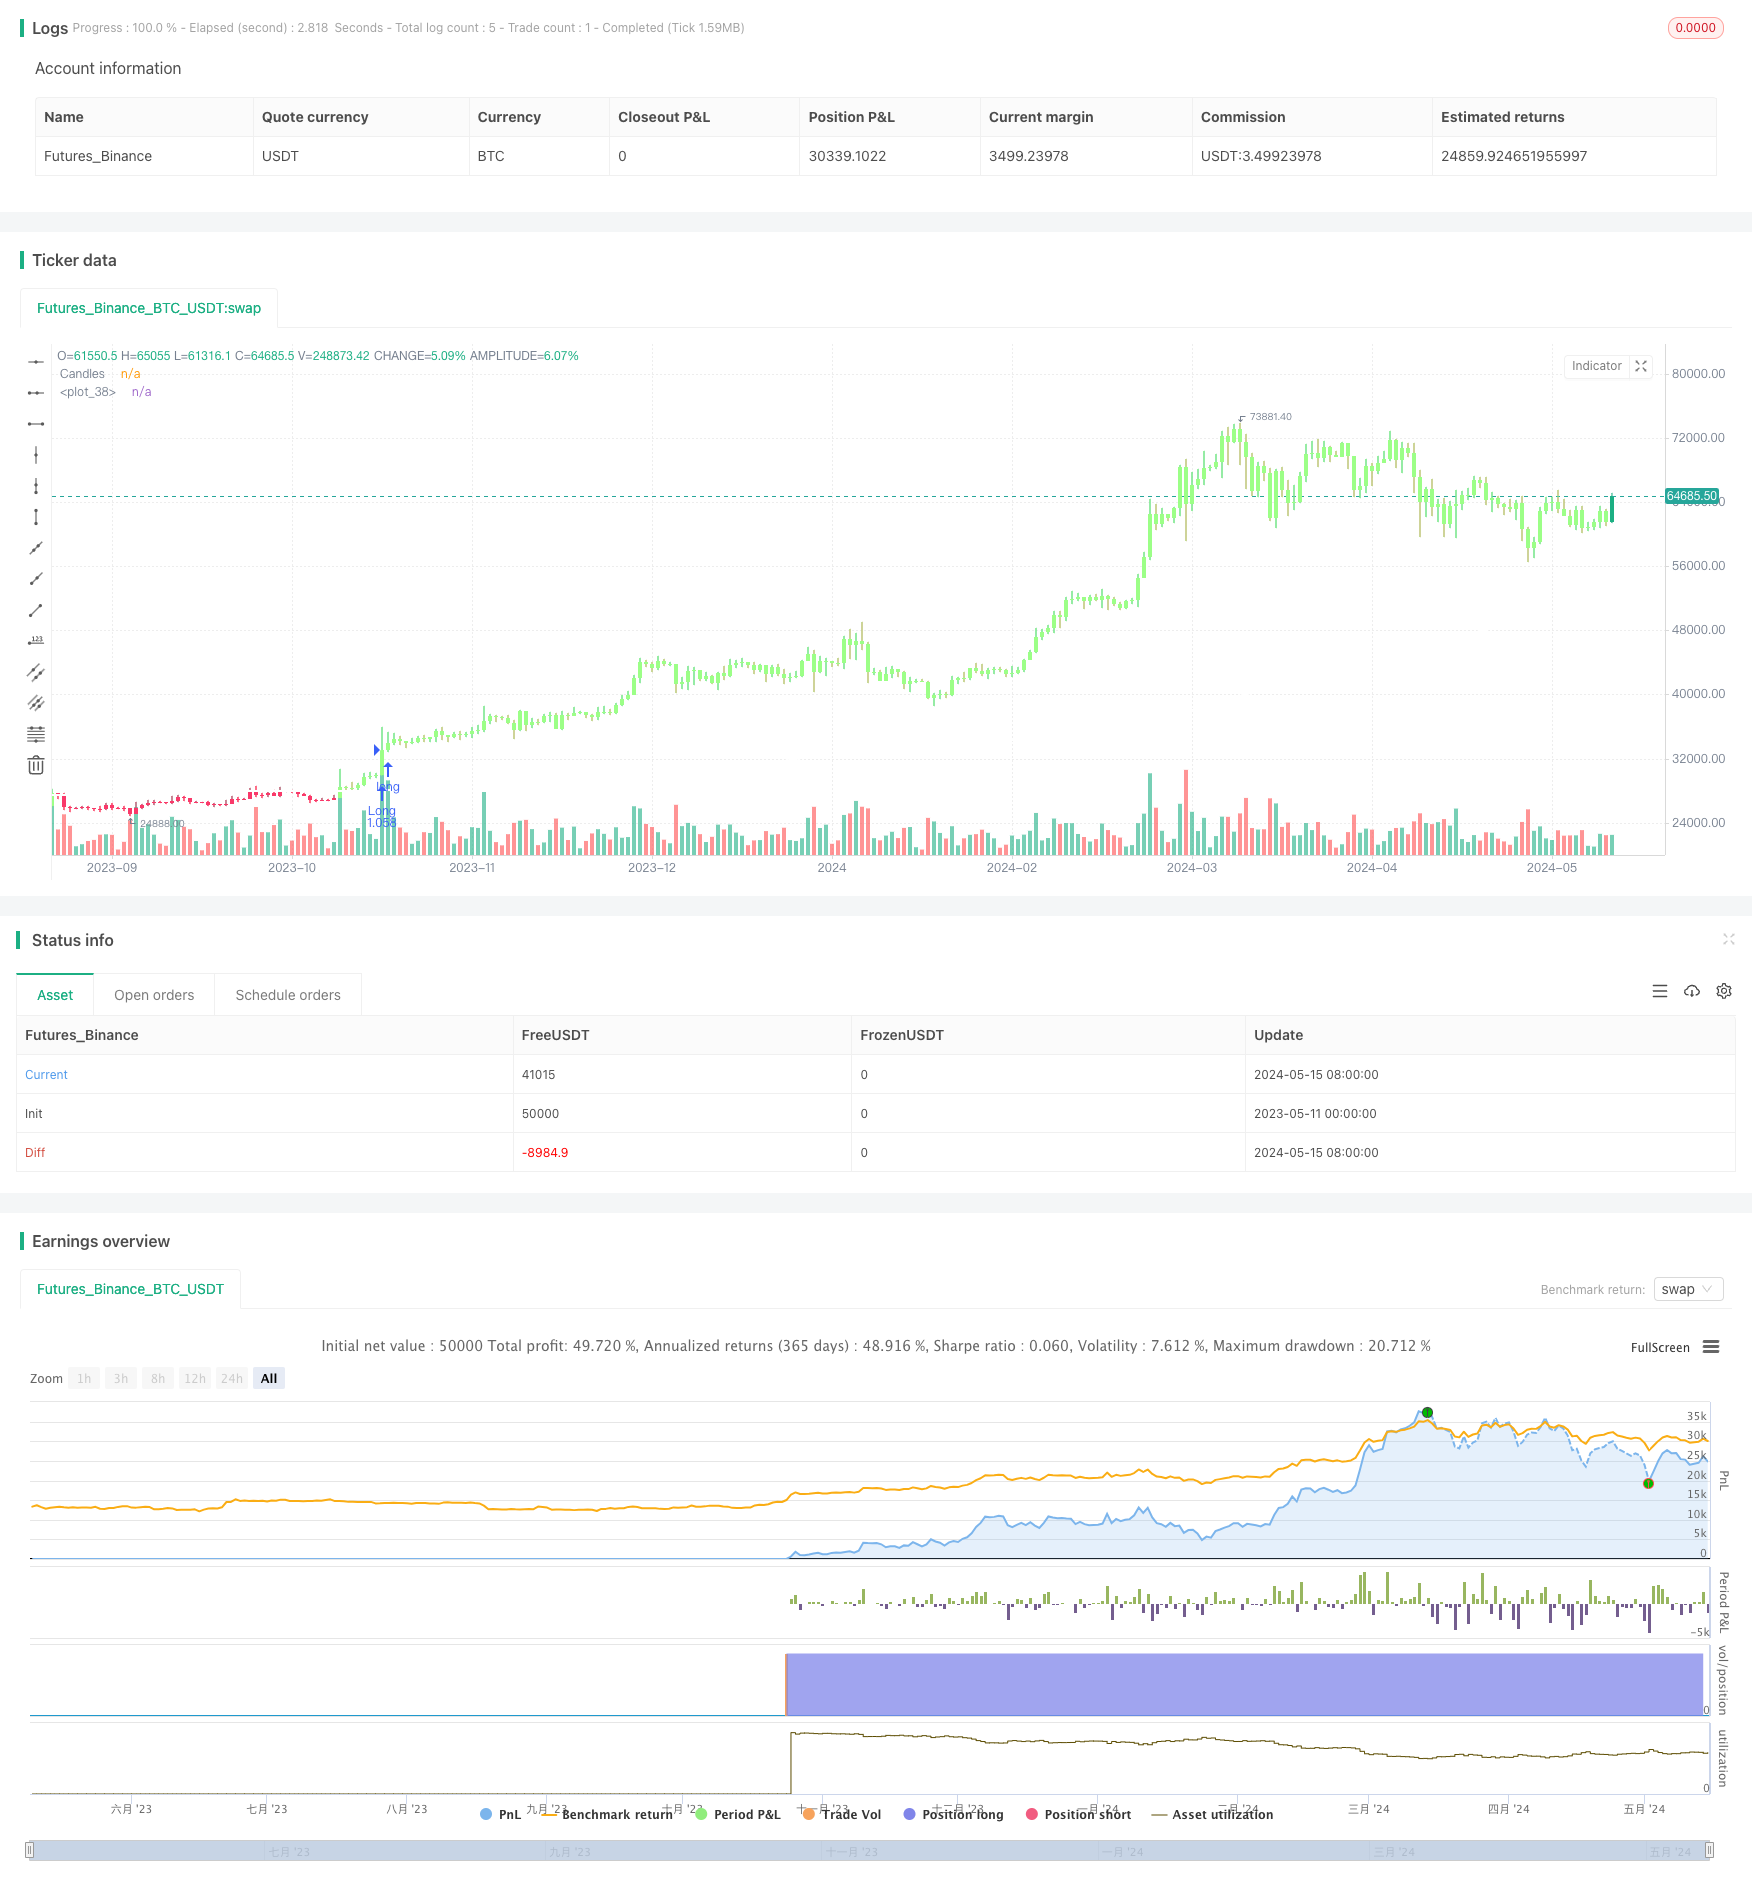
"价量突破买入策略"是一种旨在通过检测在指定的蜡烛图范围内同时出现价格和交易量突破来识别买入机会的交易策略。该策略首先将特定数量的蜡烛线作为价格和交易量的检查窗口。这些值被用作基准来识别突破条件。当收盘价和交易量都超过预定窗口内观察到的最大值时,交易就会开始。价格必须高于指定的移动平均线,作为趋势指标,确保所有交易都与主流市场趋势一致。
|
||
|
|
|
||
|
|
#### 策略原理
|
||
|
|
1. 设置价格突破周期和交易量突破周期作为检查窗口。
|
||
|
|
2. 获取价格突破周期内的最高价和最低价。
|
||
|
|
3. 获取交易量突破周期内的最高交易量。
|
||
|
|
4. 如果收盘价高于前一个周期的最高价,交易量高于前一个周期的最高交易量,收盘价高于趋势线长度的简单移动平均线(SMA),且目前没有任何开仓交易,同时订单方向设置不是做空,那么开始做多。
|
||
|
|
5. 如果连续5天收盘价低于趋势线长度的SMA,平掉所有多头仓位。
|
||
|
|
6. 如果收盘价低于前一个周期的最低价,交易量高于前一个周期的最高交易量,收盘价低于趋势线长度的SMA,且目前没有任何开仓交易,同时订单方向设置不是做多,那么开始做空。
|
||
|
|
7. 如果连续5天收盘价高于趋势线长度的SMA,平掉所有空头仓位。
|
||
|
|
|
||
|
|
#### 策略优势
|
||
|
|
1. 同时使用价格和交易量突破作为买卖信号,可以更好地确认趋势的转变。
|
||
|
|
2. 在开仓前检查价格是否高于或低于长期SMA,以确保交易符合主要市场趋势。
|
||
|
|
3. 设置连续多日收盘价穿越SMA作为平仓信号,可以有效地捕捉趋势的结束。
|
||
|
|
4. 适用于高波动性资产,如比特币和以太坊,可以利用市场突然的价格和交易量变化来获利。
|
||
|
|
|
||
|
|
#### 策略风险
|
||
|
|
1. 在市场波动较小或者没有明显趋势的情况下,该策略可能会导致频繁的交易,从而增加交易成本。
|
||
|
|
2. 对于波动性较小的市场,如标准普尔500指数,该策略的效果可能不如在加密货币市场明显。
|
||
|
|
3. 该策略在较高的时间框架下可能会产生较少的交易信号,因为大多数交易倾向于有较长的持有期。
|
||
|
|
|
||
|
|
#### 策略优化方向
|
||
|
|
1. 根据不同的市场特点,调整价格突破周期和交易量突破周期的长度,以适应不同资产的波动特征。
|
||
|
|
2. 尝试使用其他趋势确认指标,如指数移动平均线、MACD等,以提高趋势判断的准确性。
|
||
|
|
3. 在策略中加入风险管理措施,如设置止损位、动态调整仓位等,以降低单次交易的风险敞口。
|
||
|
|
4. 对于持有期较长的交易,可以考虑加入移动止盈策略,以更好地保护已获得的利润。
|
||
|
|
|
||
|
|
#### 总结
|
||
|
|
"价量突破买入策略"是一种适用于高波动性市场的趋势追踪策略。通过同时考虑价格和交易量的突破,并结合长期SMA作为趋势过滤,该策略可以较好地捕捉强势行情中的交易机会。但是,该策略在趋势不明显或者波动性较小的市场中可能表现不佳,并且可能面临频繁交易的风险。因此,在实际应用中,需要根据不同的市场特点和个人交易风格,对该策略进行适当的优化和调整,以提高其稳定性和盈利能力。
|
||
|
|
|
||
|
|
||
|
||
|
|
|
||
|
|
#### Overview
|
||
|
|
The "Price and Volume Breakout Buy Strategy" is a trading strategy designed to identify buying opportunities by detecting concurrent price and volume breakouts over a specified range of candlesticks. The strategy first takes the specific number of candlesticks as the examination window for both price and volume. These values are used as benchmarks to identify breakout conditions. A trade is initiated when both the closing price and the trading volume surpass the maximum values observed within the predetermined window. Price must be above a designated moving average, serving as the trend indicator, ensuring that all trades align with the prevailing market trend.
|
||
|
|
|
||
|
|
#### Strategy Principle
|
||
|
|
1. Set the price breakout period and volume breakout period as the examination window.
|
||
|
|
2. Get the highest price and lowest price within the price breakout period.
|
||
|
|
3. Get the highest trading volume within the volume breakout period.
|
||
|
|
4. If the closing price is higher than the highest price of the previous period, the trading volume is higher than the highest trading volume of the previous period, the closing price is higher than the simple moving average (SMA) of the trendline length, and there are currently no open trades, and the order direction is not set to short, then start going long.
|
||
|
|
5. If the closing price is lower than the SMA of the trendline length for 5 consecutive days, close all long positions.
|
||
|
|
6. If the closing price is lower than the lowest price of the previous period, the trading volume is higher than the highest trading volume of the previous period, the closing price is lower than the SMA of the trendline length, and there are currently no open trades, and the order direction is not set to long, then start going short.
|
||
|
|
7. If the closing price is higher than the SMA of the trendline length for 5 consecutive days, close all short positions.
|
||
|
|
|
||
|
|
#### Strategy Advantages
|
||
|
|
1. Using both price and volume breakouts as buy and sell signals can better confirm trend changes.
|
||
|
|
2. Checking whether the price is above or below the long-term SMA before opening a position ensures that trades are in line with the main market trend.
|
||
|
|
3. Setting the closing price crossing the SMA for multiple consecutive days as the closing signal can effectively capture the end of the trend.
|
||
|
|
4. Suitable for highly volatile assets such as Bitcoin and Ethereum, it can take advantage of sudden changes in market prices and trading volumes to profit.
|
||
|
|
|
||
|
|
#### Strategy Risks
|
||
|
|
1. In markets with low volatility or no obvious trends, this strategy may lead to frequent trades, thereby increasing transaction costs.
|
||
|
|
2. For markets with lower volatility, such as the S&P 500 index, the effect of this strategy may not be as significant as in the cryptocurrency market.
|
||
|
|
3. This strategy may generate fewer trading signals on higher timeframes, as most trades tend to have a longer holding period.
|
||
|
|
|
||
|
|
#### Strategy Optimization Direction
|
||
|
|
1. Adjust the length of the price breakout period and volume breakout period according to different market characteristics to adapt to the volatility characteristics of different assets.
|
||
|
|
2. Try to use other trend confirmation indicators, such as exponential moving averages, MACD, etc., to improve the accuracy of trend judgment.
|
||
|
|
3. Incorporate risk management measures into the strategy, such as setting stop-loss levels and dynamically adjusting positions to reduce the risk exposure of a single transaction.
|
||
|
|
4. For trades with longer holding periods, consider adding a trailing stop strategy to better protect profits already obtained.
|
||
|
|
|
||
|
|
#### Summary
|
||
|
|
The "Price and Volume Breakout Buy Strategy" is a trend-following strategy suitable for highly volatile markets. By considering both price and volume breakouts, and combining long-term SMA as a trend filter, this strategy can better capture trading opportunities in strong markets. However, this strategy may perform poorly in markets with no obvious trends or low volatility and may face the risk of frequent trading. Therefore, in practical applications, it is necessary to appropriately optimize and adjust the strategy according to different market characteristics and personal trading styles to improve its stability and profitability.
|
||
|
|
[/trans]
|
||
|
|
|
||
|
|
|
||
|
|
|
||
|
|
> Source (PineScript)
|
||
|
|
|
||
|
|
``` pinescript
|
||
|
|
/*backtest
|
||
|
|
start: 2023-05-11 00:00:00
|
||
|
|
end: 2024-05-16 00:00:00
|
||
|
|
period: 1d
|
||
|
|
basePeriod: 1h
|
||
|
|
exchanges: [{"eid":"Futures_Binance","currency":"BTC_USDT"}]
|
||
|
|
*/
|
||
|
|
|
||
|
|
// This Pine Script™ code is subject to the terms of the Mozilla Public License 2.0 at https://mozilla.org/MPL/2.0/
|
||
|
|
// © tradedots
|
||
|
|
|
||
|
|
//@version=5
|
||
|
|
strategy("Price and Volume Breakout Buy Strategy [TradeDots]", overlay=true, initial_capital = 10000, default_qty_type = strategy.percent_of_equity, default_qty_value = 70, commission_type = strategy.commission.percent, commission_value = 0.01)
|
||
|
|
|
||
|
|
input_price_breakout_period = input.int(60, "Price Breakout Period")
|
||
|
|
input_volume_breakout_period = input.int(60, "Volume Breakout Period")
|
||
|
|
input_trendline_legnth = input.int(200, "Trendline Length")
|
||
|
|
input_order_direction = input.string("Long", options = ["Long", "Short", "Long and Short"], title = "Order Direction")
|
||
|
|
|
||
|
|
price_highest = ta.highest(input_price_breakout_period)
|
||
|
|
price_lowest = ta.lowest(input_price_breakout_period)
|
||
|
|
volume_highest = ta.highest(volume, input_volume_breakout_period)
|
||
|
|
|
||
|
|
// Long Orders
|
||
|
|
if close > price_highest[1] and volume > volume_highest[1] and close > ta.sma(close, input_trendline_legnth) and strategy.opentrades == 0 and input_order_direction != "Short"
|
||
|
|
strategy.entry("Long", strategy.long)
|
||
|
|
// line.new(bar_index[input_price_breakout_period], price_highest[1], bar_index, price_highest[1], color = #9cff87, width = 2)
|
||
|
|
// label.new(bar_index,low, "? Breakout Buy", style = label.style_label_up, color = #9cff87)
|
||
|
|
|
||
|
|
// Close when price is below moving average for 5 consecutive days
|
||
|
|
if close < ta.sma(close, input_trendline_legnth) and close[1] < ta.sma(close, input_trendline_legnth) and close[2] < ta.sma(close, input_trendline_legnth) and close[3] < ta.sma(close, input_trendline_legnth) and close[4] < ta.sma(close, input_trendline_legnth) and strategy.opentrades.size(strategy.opentrades - 1) > 0
|
||
|
|
strategy.close("Long")
|
||
|
|
// label.new(bar_index, high, "? Close Position", style = label.style_label_down, color = #f9396a, textcolor = color.white)
|
||
|
|
|
||
|
|
// Short Orders
|
||
|
|
if close < price_lowest[1] and volume > volume_highest[1] and close < ta.sma(close, input_trendline_legnth) and strategy.opentrades == 0 and input_order_direction != "Long"
|
||
|
|
strategy.entry("Short", strategy.short)
|
||
|
|
// line.new(bar_index[input_price_breakout_period], price_lowest[1], bar_index, price_lowest[1], color = #f9396a, width = 2)
|
||
|
|
// label.new(bar_index,high , "? Breakout Sell", style = label.style_label_down, color = #f9396a, textcolor = color.white)
|
||
|
|
|
||
|
|
// Close when price is above moving average for 5 consecutive days
|
||
|
|
if close > ta.sma(close, input_trendline_legnth) and close[1] > ta.sma(close, input_trendline_legnth) and close[2] > ta.sma(close, input_trendline_legnth) and close[3] > ta.sma(close, input_trendline_legnth) and close[4] > ta.sma(close, input_trendline_legnth) and strategy.opentrades.size(strategy.opentrades - 1) < 0
|
||
|
|
strategy.close("Short")
|
||
|
|
// label.new(bar_index, low, "? Close Position", style = label.style_label_up, color = #9cff87)
|
||
|
|
|
||
|
|
plot(ta.sma(close, input_trendline_legnth), color = color.white, linewidth = 2)
|
||
|
|
plotcandle(open, high, low, close, title='Candles', color = (close > ta.sma(close, input_trendline_legnth) ? #9cff87 : #f9396a), wickcolor=(close > ta.sma(close, input_trendline_legnth) ? #9cff87 : #f9396a), force_overlay = true)
|
||
|
|
|
||
|
|
|
||
|
|
```
|
||
|
|
|
||
|
|
> Detail
|
||
|
|
|
||
|
|
https://www.fmz.com/strategy/451722
|
||
|
|
|
||
|
|
> Last Modified
|
||
|
|
|
||
|
|
2024-05-17 14:54:13
|