153 lines
7.3 KiB
Markdown
153 lines
7.3 KiB
Markdown

|
|
||
|
|
> Name
|
||
|
|
|
||
|
|
三重超势指标与指数移动平均线趋势跟踪量化交易策略-Triple-Supertrend-and-Exponential-Moving-Average-Trend-Following-Quantitative-Trading-Strategy
|
||
|
|
|
||
|
|
> Author
|
||
|
|
|
||
|
|
ChaoZhang
|
||
|
|
|
||
|
|
> Strategy Description
|
||
|
|
|
||
|
|
|
||
|
|
|
||
|
|
[trans]
|
||
|
|
#### 概述
|
||
|
|
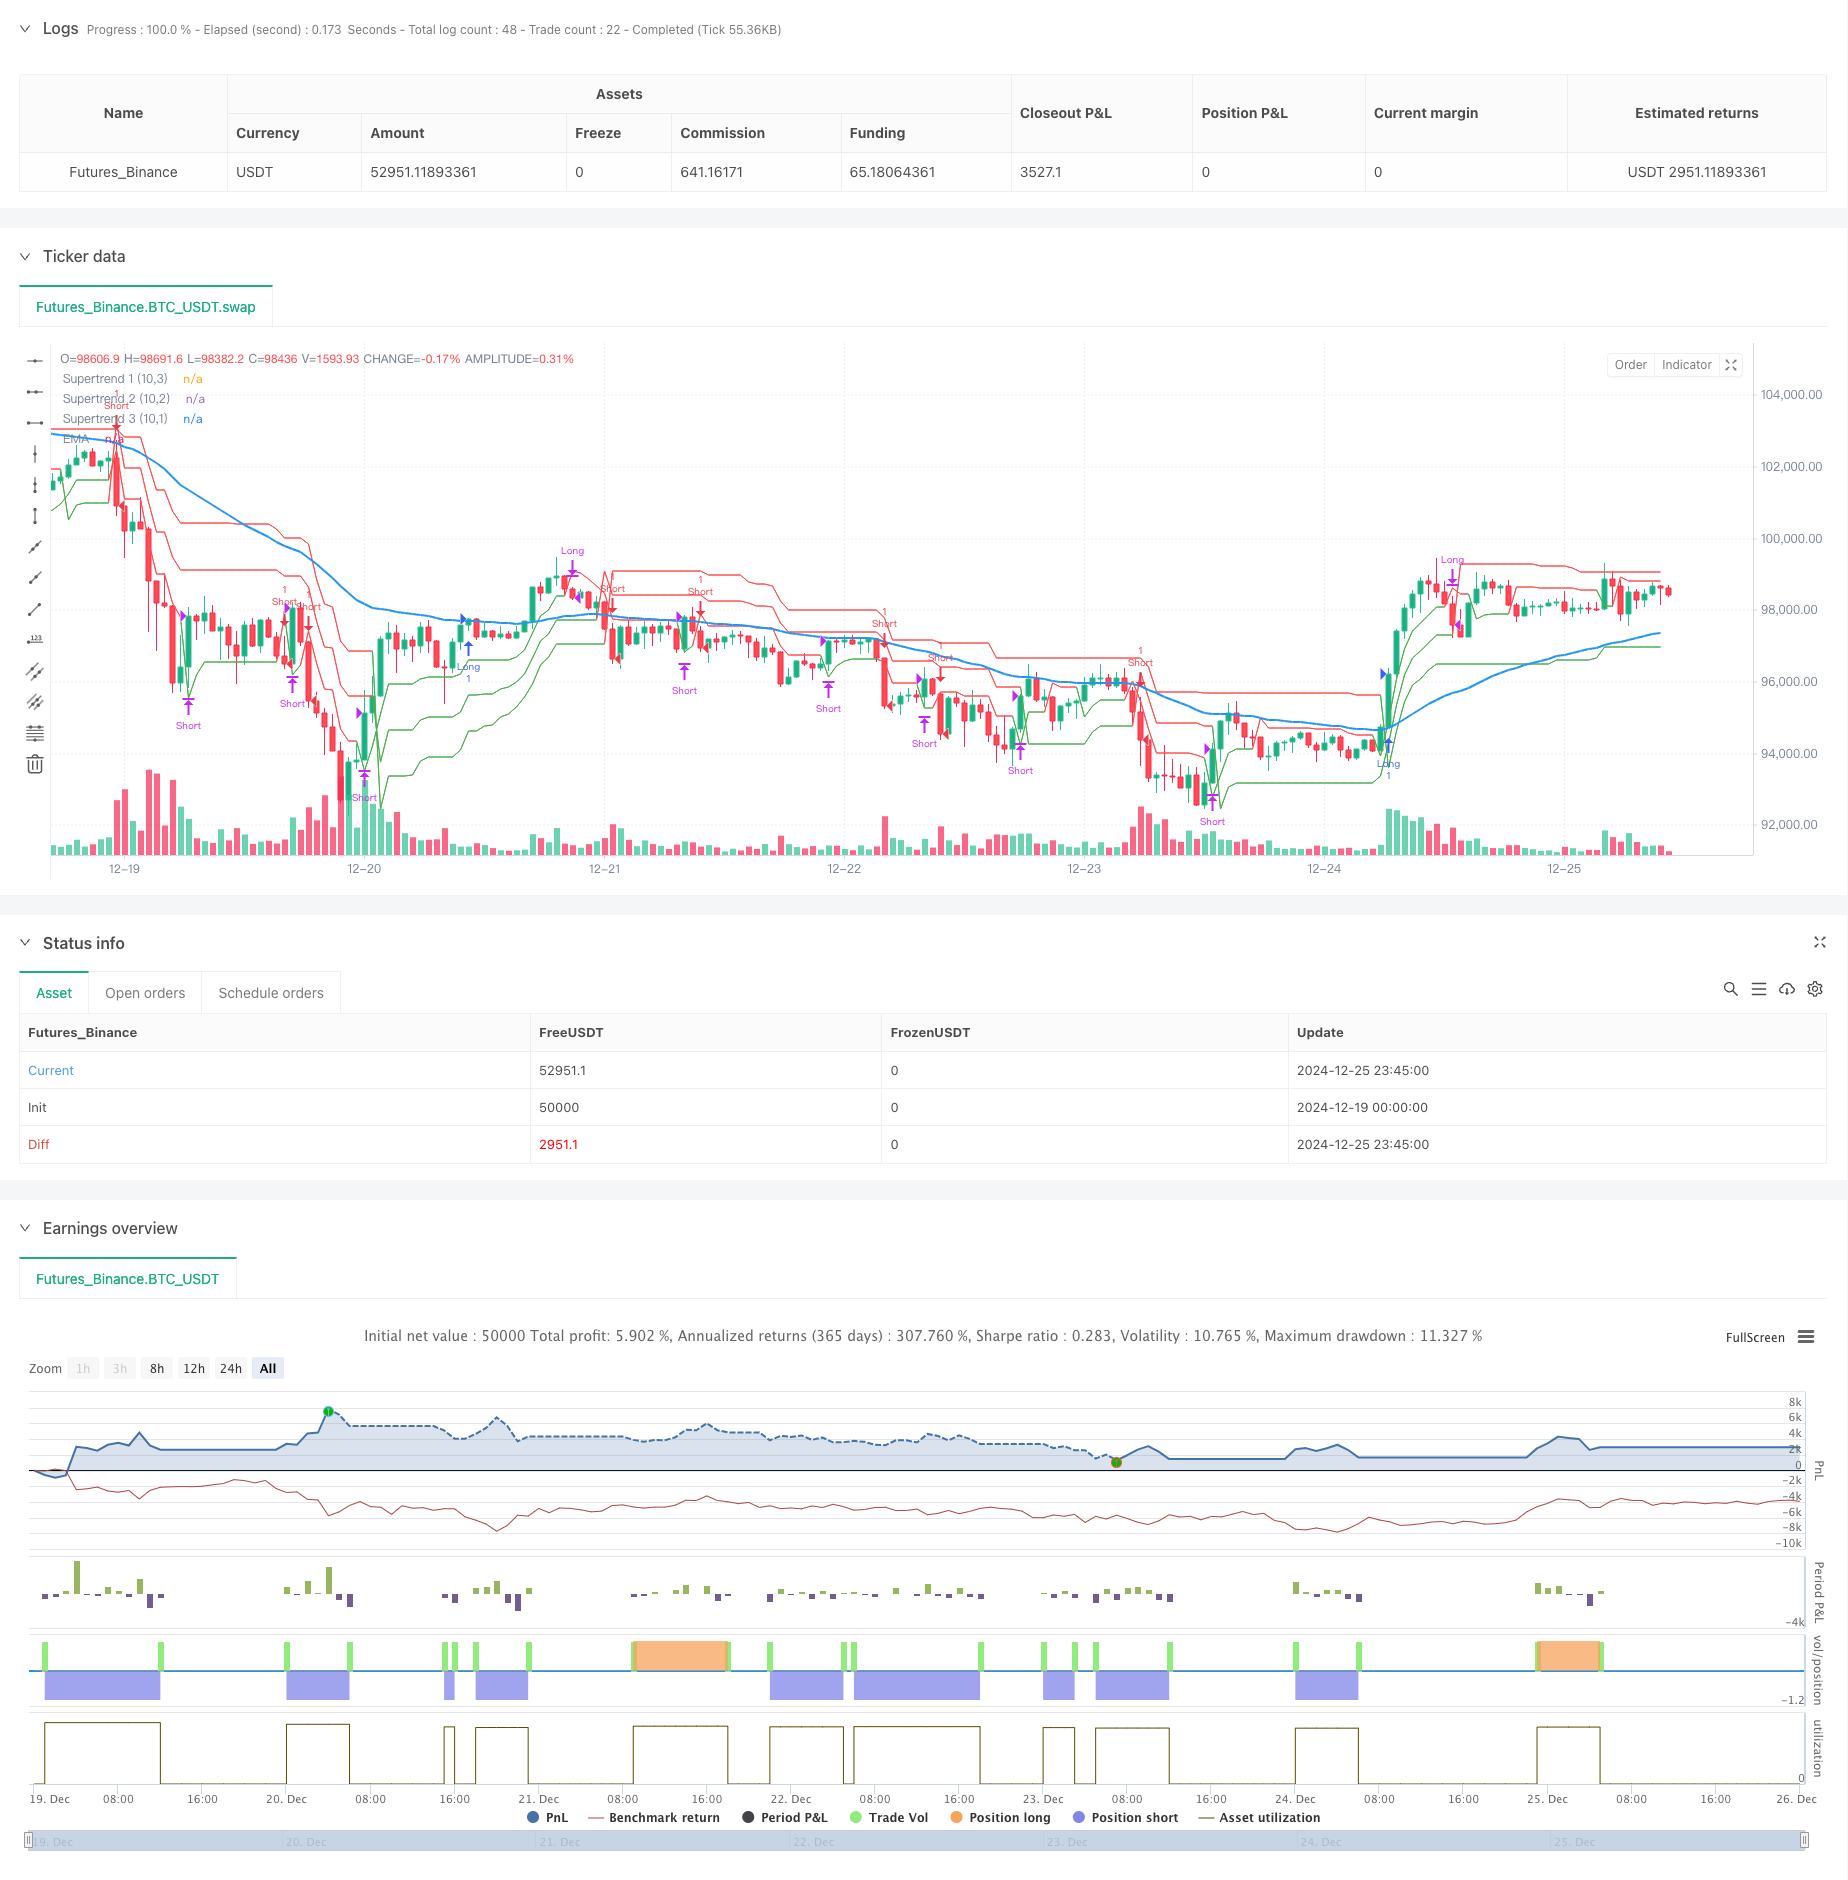
该策略是一个结合了三重超势指标(Supertrend)和指数移动平均线(EMA)的趋势跟踪策略。通过设置三条不同敏感度的超势线和一条EMA来捕捉市场趋势,实现对趋势的多维度确认。策略使用ATR(真实波幅均值)来计算动态支撑/阻力位,并根据价格与各条线的位置关系来判断趋势方向和交易信号。
|
||
|
|
|
||
|
|
#### 策略原理
|
||
|
|
策略主要包含以下核心组件:
|
||
|
|
1. 50周期EMA用于确定整体趋势方向,价格在EMA之上视为上涨趋势,反之为下跌趋势。
|
||
|
|
2. 三条超势线基于10周期ATR计算,乘数分别为3.0、2.0和1.0,敏感度依次降低。
|
||
|
|
3. 入场信号:当价格位于EMA之上且三条超势线均显示多头信号时开多;当价格位于EMA之下且三条超势线均显示空头信号时开空。
|
||
|
|
4. 出场信号:当第三条超势线(最不敏感)转向时平仓。
|
||
|
|
|
||
|
|
#### 策略优势
|
||
|
|
1. 多重确认机制提高了信号可靠性,能有效降低虚假信号。
|
||
|
|
2. 结合了短期和长期趋势指标,既能快速反应又不失稳定性。
|
||
|
|
3. 动态止损设置,能根据市场波动性自动调整。
|
||
|
|
4. 策略逻辑清晰,参数可调整性强。
|
||
|
|
5. 适用于多个市场周期,具有良好的普适性。
|
||
|
|
|
||
|
|
#### 策略风险
|
||
|
|
1. 震荡市场可能产生频繁交易,增加交易成本。
|
||
|
|
应对方案:可以增加信号过滤器或延长移动平均期。
|
||
|
|
|
||
|
|
2. 趋势反转初期可能出现滞后。
|
||
|
|
应对方案:可以引入动量指标辅助判断。
|
||
|
|
|
||
|
|
3. 多重确认机制可能错过一些盈利机会。
|
||
|
|
应对方案:可以根据市场特点适当调整确认条件。
|
||
|
|
|
||
|
|
#### 策略优化方向
|
||
|
|
1. 引入成交量指标作为辅助确认。
|
||
|
|
2. 开发自适应参数机制,根据市场状态动态调整参数。
|
||
|
|
3. 增加波动率过滤器,在高波动期间调整仓位。
|
||
|
|
4. 优化止损机制,可考虑采用移动止损。
|
||
|
|
5. 添加回撤控制模块,设置最大回撤限制。
|
||
|
|
|
||
|
|
#### 总结
|
||
|
|
这是一个逻辑严谨、稳定性强的趋势跟踪策略。通过多重技术指标的配合使用,既保证了信号的可靠性,又具备了良好的风险控制能力。策略的参数具有较强的可调整性,可以根据不同市场情况进行优化。虽然存在一定的滞后性,但通过合理的优化可以在风险和收益之间取得很好的平衡。 ||
|
||
|
|
|
||
|
|
#### Overview
|
||
|
|
This strategy combines triple Supertrend indicators with an Exponential Moving Average (EMA) for trend following. It uses three Supertrend lines with different sensitivities and one EMA line to capture market trends through multi-dimensional confirmation. The strategy utilizes ATR (Average True Range) to calculate dynamic support/resistance levels and determines trend direction and trading signals based on price positions relative to these lines.
|
||
|
|
|
||
|
|
#### Strategy Principle
|
||
|
|
The strategy consists of these core components:
|
||
|
|
1. 50-period EMA determines overall trend direction, with price above EMA indicating uptrend and below indicating downtrend.
|
||
|
|
2. Three Supertrend lines calculated using 10-period ATR with multipliers of 3.0, 2.0, and 1.0, decreasing in sensitivity.
|
||
|
|
3. Entry signals: Long when price is above EMA and all three Supertrend lines show bullish signals; Short when price is below EMA and all three Supertrend lines show bearish signals.
|
||
|
|
4. Exit signals: Close positions when the third Supertrend line (least sensitive) reverses direction.
|
||
|
|
|
||
|
|
#### Strategy Advantages
|
||
|
|
1. Multiple confirmation mechanism improves signal reliability and reduces false signals.
|
||
|
|
2. Combines short-term and long-term trend indicators for both quick response and stability.
|
||
|
|
3. Dynamic stop-loss settings that automatically adjust to market volatility.
|
||
|
|
4. Clear strategy logic with adjustable parameters.
|
||
|
|
5. Applicable across multiple market cycles with good universality.
|
||
|
|
|
||
|
|
#### Strategy Risks
|
||
|
|
1. May generate frequent trades in ranging markets, increasing transaction costs.
|
||
|
|
Solution: Add signal filters or extend moving average periods.
|
||
|
|
|
||
|
|
2. Potential lag during trend reversal initiation.
|
||
|
|
Solution: Incorporate momentum indicators for assistance.
|
||
|
|
|
||
|
|
3. Multiple confirmation requirements might miss some profitable opportunities.
|
||
|
|
Solution: Adjust confirmation conditions based on market characteristics.
|
||
|
|
|
||
|
|
#### Strategy Optimization Directions
|
||
|
|
1. Incorporate volume indicators for additional confirmation.
|
||
|
|
2. Develop adaptive parameter mechanisms that adjust dynamically to market conditions.
|
||
|
|
3. Add volatility filters to adjust position sizing during high volatility periods.
|
||
|
|
4. Optimize stop-loss mechanism, considering trailing stops.
|
||
|
|
5. Add drawdown control module with maximum drawdown limits.
|
||
|
|
|
||
|
|
#### Summary
|
||
|
|
This is a logically rigorous and stable trend-following strategy. Through the combination of multiple technical indicators, it ensures signal reliability while maintaining good risk control capabilities. The strategy parameters are highly adjustable and can be optimized for different market conditions. While there is some inherent lag, appropriate optimization can achieve a good balance between risk and return.[/trans]
|
||
|
|
|
||
|
|
|
||
|
|
|
||
|
|
> Source (PineScript)
|
||
|
|
|
||
|
|
``` pinescript
|
||
|
|
/*backtest
|
||
|
|
start: 2024-12-19 00:00:00
|
||
|
|
end: 2024-12-26 00:00:00
|
||
|
|
period: 45m
|
||
|
|
basePeriod: 45m
|
||
|
|
exchanges: [{"eid":"Futures_Binance","currency":"BTC_USDT"}]
|
||
|
|
*/
|
||
|
|
|
||
|
|
//@version=5
|
||
|
|
strategy("Supertrend EMA Strategy", overlay=true)
|
||
|
|
|
||
|
|
// Input Parameters
|
||
|
|
ema_length = input(50, title="EMA Length")
|
||
|
|
supertrend_atr_period = input(10, title="ATR Period")
|
||
|
|
supertrend_multiplier1 = input.float(3.0, title="Supertrend Multiplier 1")
|
||
|
|
supertrend_multiplier2 = input.float(2.0, title="Supertrend Multiplier 2")
|
||
|
|
supertrend_multiplier3 = input.float(1.0, title="Supertrend Multiplier 3")
|
||
|
|
|
||
|
|
// Calculations
|
||
|
|
emaValue = ta.ema(close, ema_length)
|
||
|
|
|
||
|
|
[supertrend1, SupertrendDirection1] = ta.supertrend(supertrend_multiplier1, supertrend_atr_period)
|
||
|
|
[supertrend2, SupertrendDirection2] = ta.supertrend(supertrend_multiplier2, supertrend_atr_period)
|
||
|
|
[supertrend3, SupertrendDirection3] = ta.supertrend(supertrend_multiplier3, supertrend_atr_period)
|
||
|
|
|
||
|
|
// Plot Indicators
|
||
|
|
plot(emaValue, title="EMA", color=color.blue, linewidth=2)
|
||
|
|
plot(supertrend1, title="Supertrend 1 (10,3)", color=(SupertrendDirection1 == -1 ? color.green : color.red), linewidth=1, style=plot.style_line)
|
||
|
|
plot(supertrend2, title="Supertrend 2 (10,2)", color=(SupertrendDirection2 == -1 ? color.green : color.red), linewidth=1, style=plot.style_line)
|
||
|
|
plot(supertrend3, title="Supertrend 3 (10,1)", color=(SupertrendDirection3 == -1 ? color.green : color.red), linewidth=1, style=plot.style_line)
|
||
|
|
|
||
|
|
// Entry Conditions
|
||
|
|
long_condition = (SupertrendDirection1 == -1 and SupertrendDirection2 == -1 and SupertrendDirection3 == -1 and close > emaValue)
|
||
|
|
short_condition = (SupertrendDirection1 == 1 and SupertrendDirection2 == 1 and SupertrendDirection3 == 1 and close < emaValue)
|
||
|
|
|
||
|
|
// Exit Conditions
|
||
|
|
long_exit = (SupertrendDirection3 == 1)
|
||
|
|
short_exit = (SupertrendDirection3 == -1)
|
||
|
|
|
||
|
|
// Execute Strategy
|
||
|
|
if (long_condition)
|
||
|
|
strategy.entry("Long", strategy.long)
|
||
|
|
if (short_condition)
|
||
|
|
strategy.entry("Short", strategy.short)
|
||
|
|
|
||
|
|
if (long_exit)
|
||
|
|
strategy.close("Long")
|
||
|
|
if (short_exit)
|
||
|
|
strategy.close("Short")
|
||
|
|
|
||
|
|
```
|
||
|
|
|
||
|
|
> Detail
|
||
|
|
|
||
|
|
https://www.fmz.com/strategy/476281
|
||
|
|
|
||
|
|
> Last Modified
|
||
|
|
|
||
|
|
2024-12-27 15:56:53
|