207 lines
11 KiB
Markdown
207 lines
11 KiB
Markdown

|
|
||
|
|
> Name
|
||
|
|
|
||
|
|
一文中局部震荡趋势识别策略Ichimoku-Cloud-Local-Trend-Identification-Strategy
|
||
|
|
|
||
|
|
> Author
|
||
|
|
|
||
|
|
ChaoZhang
|
||
|
|
|
||
|
|
> Strategy Description
|
||
|
|
|
||
|
|
|
||
|
|
[trans]
|
||
|
|
|
||
|
|
## 概述
|
||
|
|
|
||
|
|
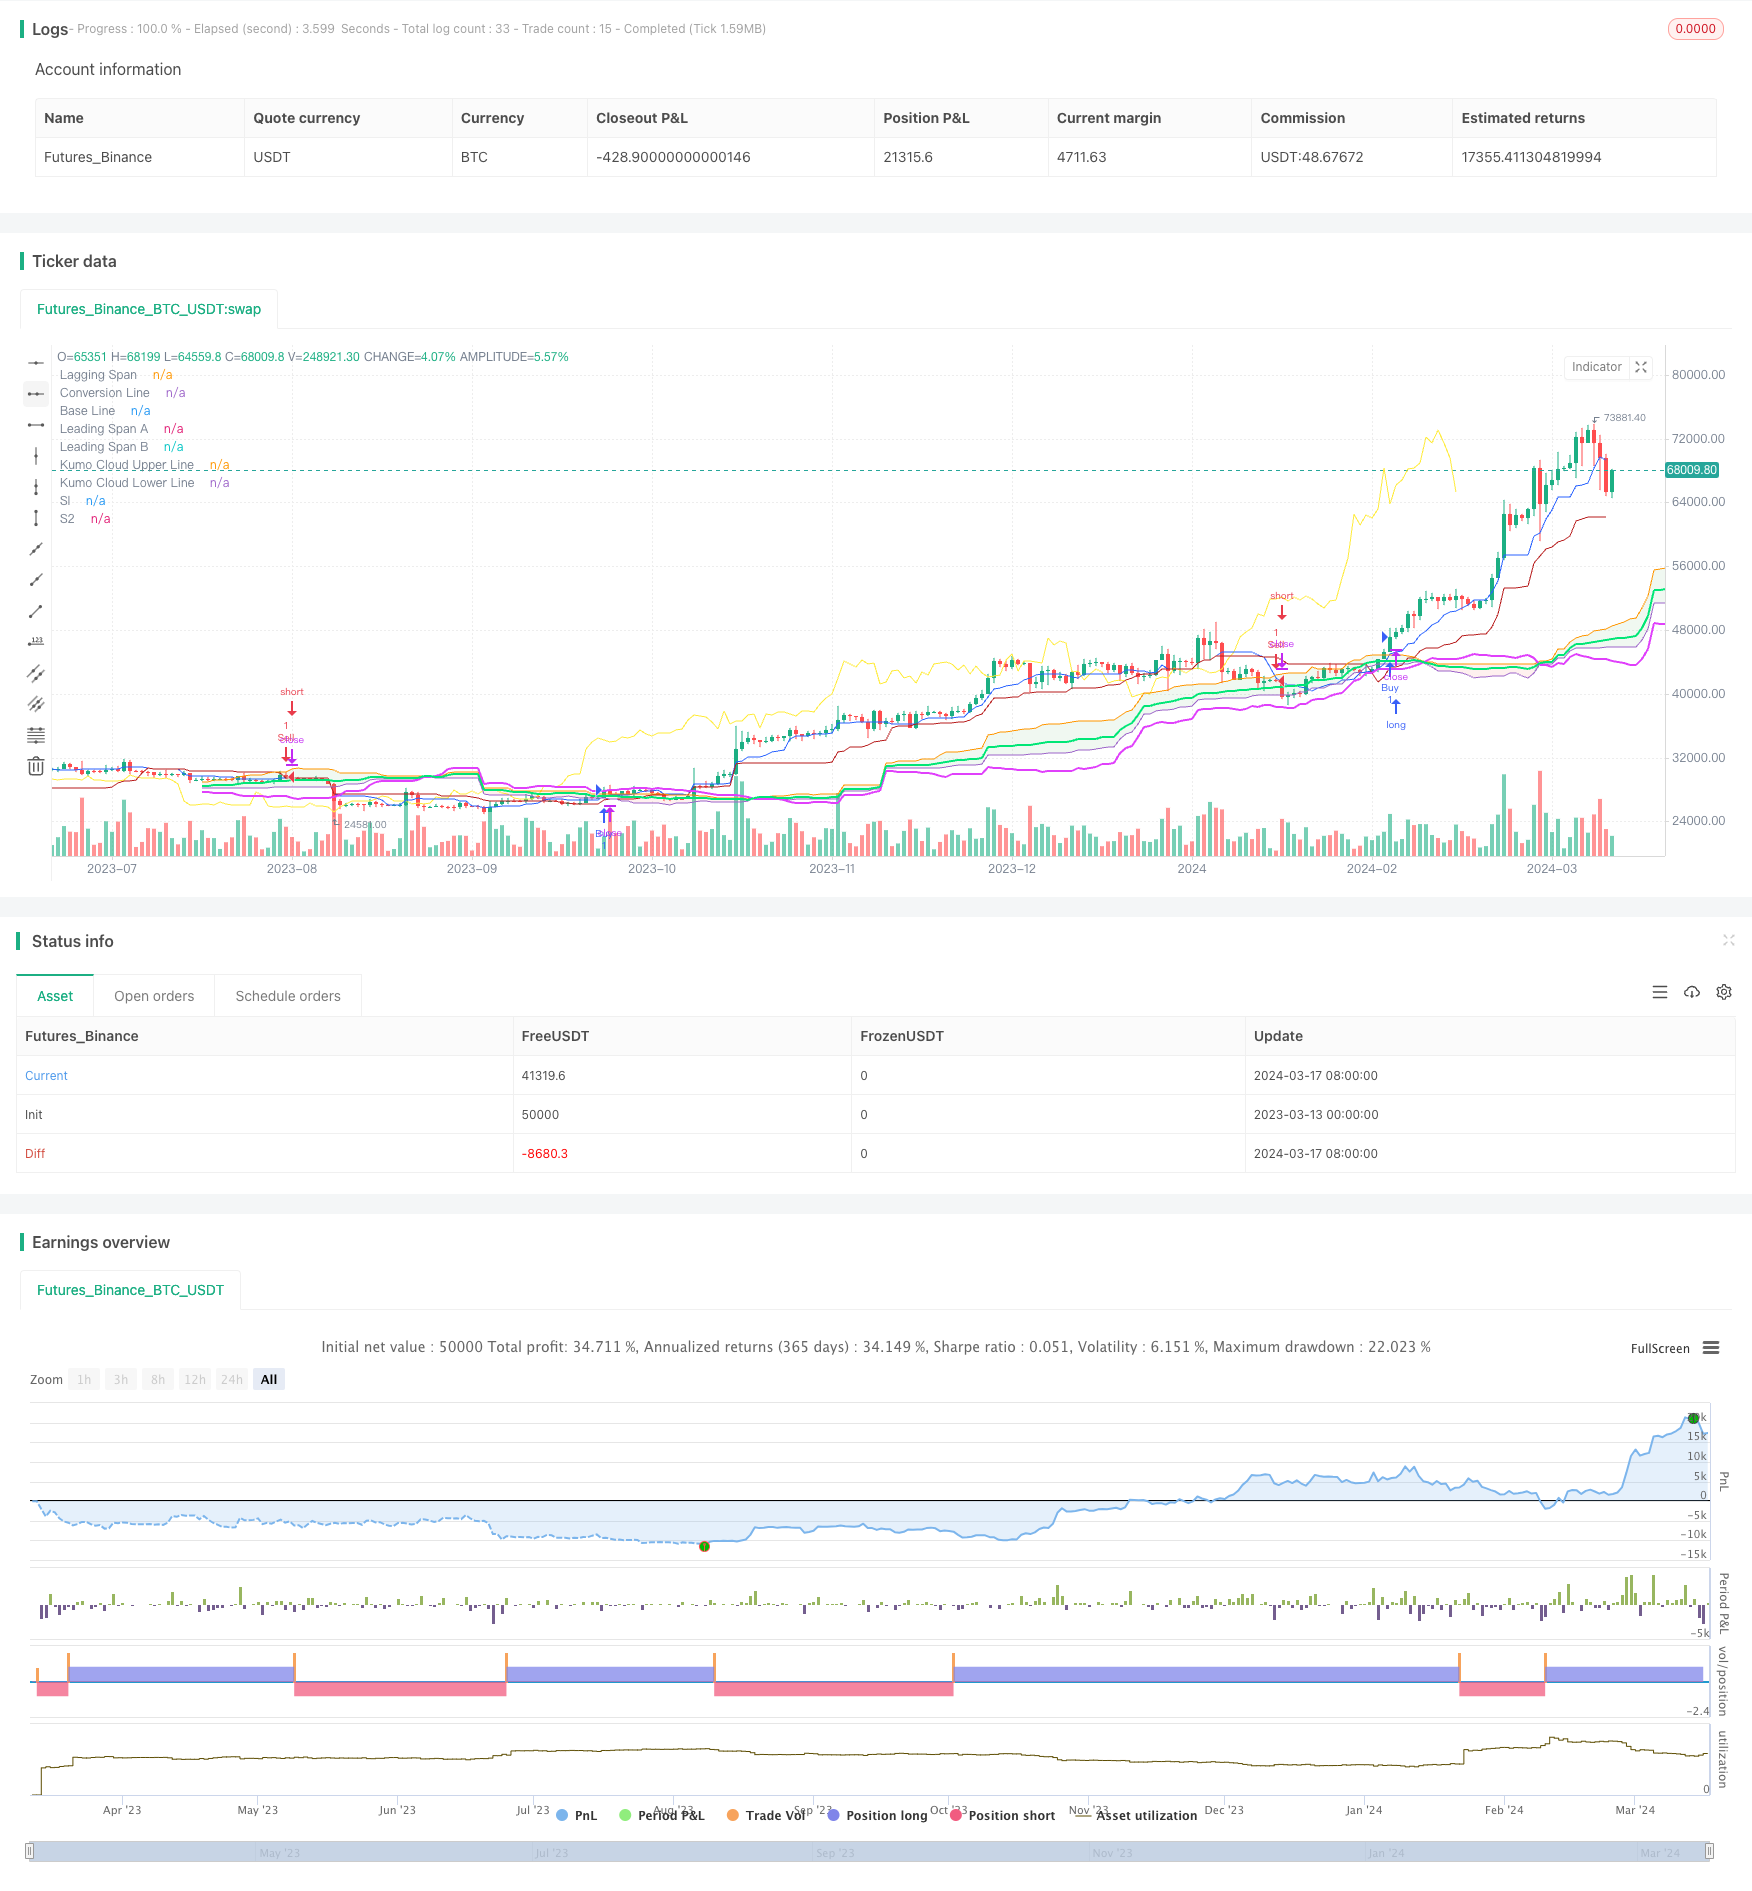
该策略是基于一文云指标(Ichimoku Cloud)结合黄金分割率(Fibonacci Ratio)设计的一种趋势识别和交易策略。策略使用一文云指标中的转换线(Conversion Line)、基线(Base Line)、云(Kumo Cloud)以及延迟线(Lagging Span)来判断当前市场趋势,并结合1.618和0.618两个黄金分割率来设置止损位和识别震荡市场。此外,策略还引入了两条额外的中线来过滤假信号。
|
||
|
|
|
||
|
|
## 策略原理
|
||
|
|
|
||
|
|
一文云指标由转换线、基线、云以及延迟线四个部分组成。其中,转换线和基线分别由不同周期的最高价和最低价的平均值计算得出,云由基线向前推移26个周期形成,延迟线则是收盘价向后推移26个周期。
|
||
|
|
|
||
|
|
该策略的多头开仓条件如下:
|
||
|
|
|
||
|
|
1. 延迟线在云上方
|
||
|
|
2. 转换线高于基线
|
||
|
|
3. 收盘价高于1.618止损位
|
||
|
|
4. 0.618线高于1.618止损位
|
||
|
|
5. 收盘价在云上方
|
||
|
|
|
||
|
|
空头开仓条件则与多头相反。
|
||
|
|
|
||
|
|
止损位置的设置使用了1.618和0.618两个黄金分割率。多头止损位为云的上沿减去上下沿距离的1.618倍,空头止损位则相反。0.618线用于识别震荡市场,当云为绿色且0.618线低于1.618止损位时,认为市场处于震荡状态。
|
||
|
|
|
||
|
|
除了一文云指标外,该策略还引入了两条中线来过滤假信号。中线由不同周期的最高最低价平均值计算得出。
|
||
|
|
|
||
|
|
## 优势分析
|
||
|
|
|
||
|
|
1. 同时使用价格和趋势指标,可以较好地识别当前市场趋势。
|
||
|
|
2. 引入黄金分割率动态设置止损位,风险可控。
|
||
|
|
3. 0.618线可以有效识别震荡市场,避免在震荡行情下频繁开仓。
|
||
|
|
4. 两条额外的中线可以进一步过滤假信号,提高信号质量。
|
||
|
|
5. 参数可调,适用于不同的市场和周期。
|
||
|
|
|
||
|
|
## 风险分析
|
||
|
|
|
||
|
|
1. 在极端行情下,如暴涨暴跌行情,趋势指标可能失效,导致信号失真。
|
||
|
|
2. 止损位基于云的距离计算,在云很薄的情况下可能导致止损过于靠近开仓价。
|
||
|
|
3. 黄金分割率止损和0.618线判断震荡市场的方法缺乏理论支撑,可能并不适用于所有市场。
|
||
|
|
4. 参数优化可能导致过拟合,在实际市场中表现不佳。
|
||
|
|
|
||
|
|
## 优化方向
|
||
|
|
|
||
|
|
1. 可以考虑引入更多趋势确认指标,如均线系统、MACD等,进一步提高信号质量。
|
||
|
|
2. 止损位的设置可以考虑更多因素,如ATR、波动率等,使其更加动态化和个性化。
|
||
|
|
3. 对于震荡市场的判断,可以尝试其他方法,如趋势强度指标ADX等。
|
||
|
|
4. 参数的优化可以使用遗传算法等机器学习方法,并进行样本外测试来避免过拟合。
|
||
|
|
5. 可以加入仓位管理和风险控制模块,如Kelly准则、固定风险等,以提高策略的稳健性和可靠性。
|
||
|
|
|
||
|
|
## 总结
|
||
|
|
|
||
|
|
该策略创新性地将一文云指标和黄金分割率结合,形成了一套完整的趋势识别和交易系统。同时引入额外的中线过滤,可以在一定程度上提高信号质量。策略的优势在于能够较好地适应趋势和震荡两种市场状态,并通过动态止损控制风险。但策略也存在一些不足之处,如缺乏理论支撑,参数优化可能过拟合等。未来可以从引入更多指标、优化止损和仓位管理、机器学习参数优化等方面对策略进行完善。总的来说,该策略思路新颖,具有一定的参考价值,但在实际应用中还需要进一步的测试和优化。
|
||
|
|
|
||
|
|
||
|
||
|
|
|
||
|
|
## Overview
|
||
|
|
|
||
|
|
This strategy is a trend identification and trading strategy based on the Ichimoku Cloud indicator combined with Fibonacci Ratios. It uses the Conversion Line, Base Line, Kumo Cloud, and Lagging Span from the Ichimoku Cloud indicator to determine the current market trend, and incorporates the 1.618 and 0.618 Fibonacci Ratios to set stop-loss levels and identify sideways markets. Additionally, the strategy introduces two extra mid-lines to filter out false signals.
|
||
|
|
|
||
|
|
## Strategy Principle
|
||
|
|
|
||
|
|
The Ichimoku Cloud indicator consists of four components: the Conversion Line, Base Line, Kumo Cloud, and Lagging Span. The Conversion Line and Base Line are calculated using the average of the highest high and lowest low over different time periods. The Kumo Cloud is formed by shifting the Base Line forward by 26 periods, and the Lagging Span is the closing price shifted backwards by 26 periods.
|
||
|
|
|
||
|
|
The long entry conditions for this strategy are as follows:
|
||
|
|
|
||
|
|
1. The Lagging Span is above the cloud
|
||
|
|
2. The Conversion Line is greater than the Base Line
|
||
|
|
3. The closing price is above the 1.618 stop-loss level
|
||
|
|
4. The 0.618 line is above the 1.618 stop-loss level
|
||
|
|
5. The closing price is above the cloud
|
||
|
|
|
||
|
|
The short entry conditions are the opposite of the long entry conditions.
|
||
|
|
|
||
|
|
The stop-loss levels are set using the 1.618 and 0.618 Fibonacci Ratios. For long positions, the stop-loss is the upper edge of the cloud minus 1.618 times the distance between the upper and lower edges. For short positions, it is the opposite. The 0.618 line is used to identify sideways markets. When the cloud is green and the 0.618 line is below the 1.618 stop-loss level, the market is considered to be in a sideways state.
|
||
|
|
|
||
|
|
In addition to the Ichimoku Cloud indicator, the strategy introduces two mid-lines to further filter out false signals. The mid-lines are calculated using the average of the highest high and lowest low over different time periods.
|
||
|
|
|
||
|
|
## Advantage Analysis
|
||
|
|
|
||
|
|
1. By using both price and trend indicators, the strategy can better identify the current market trend.
|
||
|
|
2. Introducing Fibonacci Ratios to dynamically set stop-loss levels makes risk controllable.
|
||
|
|
3. The 0.618 line can effectively identify sideways markets and avoid frequent entries in ranging markets.
|
||
|
|
4. The two extra mid-lines can further filter out false signals and improve signal quality.
|
||
|
|
5. Parameters are adjustable, making the strategy suitable for different markets and timeframes.
|
||
|
|
|
||
|
|
## Risk Analysis
|
||
|
|
|
||
|
|
1. In extreme market conditions, such as strong uptrends or downtrends, trend indicators may fail, leading to distorted signals.
|
||
|
|
2. The stop-loss level is based on the distance of the cloud. When the cloud is very thin, it may result in the stop-loss being too close to the entry price.
|
||
|
|
3. The method of using Fibonacci Ratios for stop-loss and the 0.618 line to judge sideways markets lacks theoretical support and may not be applicable to all markets.
|
||
|
|
4. Parameter optimization may lead to overfitting and poor performance in real markets.
|
||
|
|
|
||
|
|
## Optimization Directions
|
||
|
|
|
||
|
|
1. Consider introducing more trend confirmation indicators, such as moving averages, MACD, etc., to further improve signal quality.
|
||
|
|
2. The setting of stop-loss levels can take into account more factors, such as ATR and volatility, to make them more dynamic and personalized.
|
||
|
|
3. For identifying sideways markets, other methods such as the ADX trend strength indicator can be tried.
|
||
|
|
4. Machine learning methods such as genetic algorithms can be used for parameter optimization, and out-of-sample testing should be conducted to avoid overfitting.
|
||
|
|
5. Position sizing and risk control modules can be added, such as the Kelly Criterion and fixed risk, to improve the robustness and reliability of the strategy.
|
||
|
|
|
||
|
|
## Conclusion
|
||
|
|
|
||
|
|
This strategy innovatively combines the Ichimoku Cloud indicator with Fibonacci Ratios to form a complete trend identification and trading system. The introduction of extra mid-lines for filtering can improve signal quality to a certain extent. The strategy's advantage lies in its ability to adapt well to both trending and ranging market conditions, and to control risk through dynamic stop-losses. However, the strategy also has some shortcomings, such as lack of theoretical support and potential overfitting in parameter optimization. In the future, the strategy can be improved by introducing more indicators, optimizing stop-losses and position sizing, and using machine learning for parameter optimization. Overall, this strategy has an innovative approach and is worth referencing, but further testing and optimization are needed for practical application.
|
||
|
|
|
||
|
|
[/trans]
|
||
|
|
|
||
|
|
> Strategy Arguments
|
||
|
|
|
||
|
|
|
||
|
|
|
||
|
|
|Argument|Default|Description|
|
||
|
|
|----|----|----|
|
||
|
|
|v_input_int_1|9|Conversion Line Length|
|
||
|
|
|v_input_int_2|26|Base Line Length|
|
||
|
|
|v_input_int_3|52|Leading Span B Length|
|
||
|
|
|v_input_int_4|17|PPL1|
|
||
|
|
|v_input_int_5|39|PPL2|
|
||
|
|
|v_input_int_6|26|Lagging Span|
|
||
|
|
|v_input_float_1|1.618|Mult1|
|
||
|
|
|v_input_float_2|0.618|Mult2|
|
||
|
|
|
||
|
|
|
||
|
|
> Source (PineScript)
|
||
|
|
|
||
|
|
``` pinescript
|
||
|
|
/*backtest
|
||
|
|
start: 2023-03-13 00:00:00
|
||
|
|
end: 2024-03-18 00:00:00
|
||
|
|
period: 1d
|
||
|
|
basePeriod: 1h
|
||
|
|
exchanges: [{"eid":"Futures_Binance","currency":"BTC_USDT"}]
|
||
|
|
*/
|
||
|
|
|
||
|
|
// This Pine Script™ code is subject to the terms of the Mozilla Public License 2.0 at https://mozilla.org/MPL/2.0/
|
||
|
|
// © manoharbauskar
|
||
|
|
|
||
|
|
//@version=5
|
||
|
|
// This Pine Script™ code is subject to the terms of the Mozilla Public License 2.0 at https://mozilla.org/MPL/2.0/
|
||
|
|
// © manoharbauskar
|
||
|
|
|
||
|
|
//@version=5
|
||
|
|
strategy("Advanced_Ichimoku_Cloud_Strategy", overlay=true, margin_long=100, margin_short=100)
|
||
|
|
conversionPeriods = input.int(9, minval=1, title="Conversion Line Length")
|
||
|
|
basePeriods = input.int(26, minval=1, title="Base Line Length")
|
||
|
|
laggingSpanPeriods = input.int(52, minval=1, title="Leading Span B Length")
|
||
|
|
pivotPeriods1 = input.int(17,minval = 1,title = "PPL1")
|
||
|
|
pivotPeriods2 = input.int(39,minval = 1,title = "PPL2")
|
||
|
|
displacement = input.int(26, minval=1, title="Lagging Span")
|
||
|
|
donchian(len) => math.avg(ta.lowest(len), ta.highest(len))
|
||
|
|
conversionLine = donchian(conversionPeriods)
|
||
|
|
baseLine = donchian(basePeriods)
|
||
|
|
midLine1 = donchian(pivotPeriods1)
|
||
|
|
midLine2 = donchian(pivotPeriods2)
|
||
|
|
midLine3 = donchian(laggingSpanPeriods)
|
||
|
|
leadLine1 = math.avg(conversionLine, baseLine, midLine1)
|
||
|
|
leadLine2 = math.avg(midLine2 , midLine3)
|
||
|
|
|
||
|
|
|
||
|
|
plot(conversionLine, color=#2962FF, title="Conversion Line")
|
||
|
|
plot(baseLine, color=#B71C1C, title="Base Line")
|
||
|
|
|
||
|
|
plot(close, offset = -displacement + 1, color=color.yellow, title="Lagging Span")
|
||
|
|
p1 = plot(leadLine1, offset = displacement - 1, color=#A5D6A7,
|
||
|
|
title="Leading Span A")
|
||
|
|
p2 = plot(leadLine2, offset = displacement - 1, color=#EF9A9A,
|
||
|
|
title="Leading Span B")
|
||
|
|
|
||
|
|
plot(leadLine1 > leadLine2 ? leadLine1 : leadLine2, offset = displacement - 1, title = "Kumo Cloud Upper Line", display = display.none)
|
||
|
|
plot(leadLine1 < leadLine2 ? leadLine1 : leadLine2, offset = displacement - 1, title = "Kumo Cloud Lower Line", display = display.none)
|
||
|
|
fill(p1, p2, color = leadLine1 > leadLine2 ? color.rgb(67, 160, 71, 90) : color.rgb(244, 67, 54, 90))
|
||
|
|
|
||
|
|
//stoploss calculating
|
||
|
|
mult1 = input.float(1.618, "Mult1")
|
||
|
|
mult2 = input.float(0.618, "Mult2")
|
||
|
|
stoploss1 = leadLine1 - (leadLine1 - leadLine2)*mult1
|
||
|
|
stoploss2 = leadLine1 - (leadLine1 - leadLine2)*mult2
|
||
|
|
plot(stoploss1,"Sl", color = color.fuchsia, linewidth = 2, style = plot.style_line, offset = displacement - 1)
|
||
|
|
plot(stoploss2,"S2", color = color.lime, linewidth = 2, style = plot.style_line, offset = displacement - 1)
|
||
|
|
|
||
|
|
longCondition = leadLine1 > leadLine2
|
||
|
|
if (longCondition)
|
||
|
|
strategy.entry("Buy", strategy.long)
|
||
|
|
|
||
|
|
shortCondition = leadLine1 < leadLine2
|
||
|
|
if (shortCondition)
|
||
|
|
strategy.entry("Sell", strategy.short)
|
||
|
|
|
||
|
|
```
|
||
|
|
|
||
|
|
> Detail
|
||
|
|
|
||
|
|
https://www.fmz.com/strategy/445451
|
||
|
|
|
||
|
|
> Last Modified
|
||
|
|
|
||
|
|
2024-03-19 15:10:59
|